
Solved

Show results in tables and charts as last 365 days

  • January 10, 2022
  • 2 replies
  • 97 views
  • Translate All

Forum|alt.badge.img

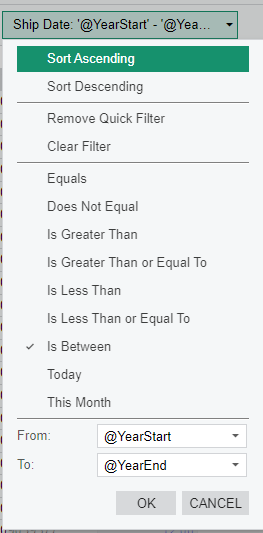
I am trying to use a pivot table to show the sum of sales of an inventory item over the last 365, or trailing 12 months. Acumaitca only gives me the option of using “@YearStart” and “@YearEnd”. I was wondering if there was a value I could type in from trailing 365 days today.


Best answer by Neil Cantral

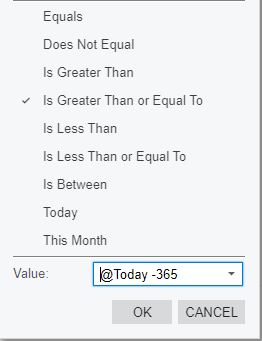
Try something like this:


View original

2 replies

Neil Cantral
Jr Varsity I
Forum|alt.badge.img+5

Try something like this:


Translate

Forum|alt.badge.img
  • Author
  • Freshman II
  • January 10, 2022

It appears this has solved my issue, thank you!

Translate