Hi Acumatica Community,
Is there available screen in acumatica that shows overall response time or uptime globally.
Please see attached reference below.
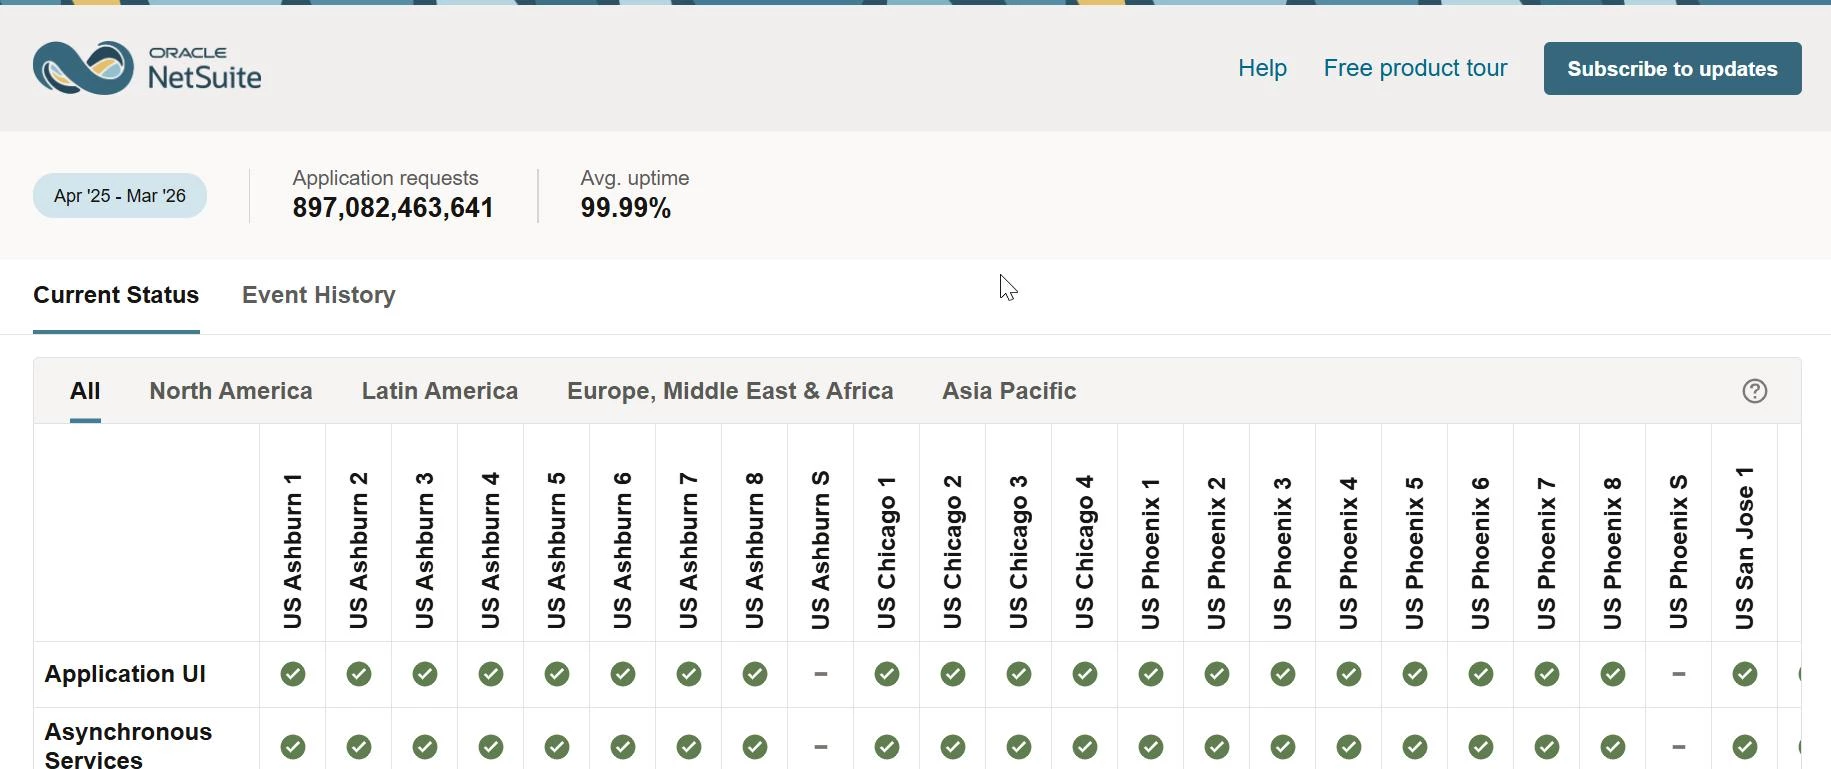
Here’s also what we have but not suffice the requirements.
Thank you!
Hi Acumatica Community,
Is there available screen in acumatica that shows overall response time or uptime globally.
Please see attached reference below.
Here’s also what we have but not suffice the requirements.
Thank you!
No account yet? Create an account
Enter your E-mail address. We'll send you an e-mail with instructions to reset your password.