Question

Is there any way to present GI detail vertically?

  • July 8, 2026
  • 4 replies
  • 76 views

Forum|alt.badge.img+1

I’ve been asked to provide a sidepanel on a few screens that will display the Remit To address of the vendor on the current screen.  That part is pretty easy and I’ve already provided that to the users.

But the sidepanel is displaying the results of a GI (the Sidepanel technically points to a Dashboard that has a Data Table widget on it that displays the GI results).  The results are displayed horizontally, and since it’s displaying 5 fields, the results are kinda squished.  I’d love to display the results vertically, like:

Addr 1: 123 Main Street
Addr 2: Box 17
City:  Anytown
State: PA
Postal Code: 12345

I’ve tried a pivot table but that’s not really what pivot tables are designed for.

The only solution I can think of is developing a custom form screen and tying the sidepanel to that.  That kind of form screen is pretty simple...but I feel like I’m going down a rabbit hole for something that doesn’t justify that much work.
4 replies

Forum|alt.badge.img+3

@lairdtim Convert the existing Generic Inquiry (GI) into a report using Report Designer, and configure the report to be displayed as a side panel.

This will allow the information to be presented in a vertical layout, making it easier to view the details alongside the main screen.


BenjaminCrisman
Acumatica Employee
Forum|alt.badge.img+4

@lairdtim The data table will display just like the GI results, but have you looked into a PowerBI widget? You might be able to make one which looks like what you’re looking for.


Forum|alt.badge.img+1
  • Author
  • Semi-Pro II
  • July 8, 2026

@lairdtim The data table will display just like the GI results, but have you looked into a PowerBI widget? You might be able to make one which looks like what you’re looking for.

We’re just starting to play with those.  I figure we could make it work, but getting that data into our data warehouse and PowerBI may be a bigger lift than I’d like.  We capture Vendors already, but getting all the way down to default location and remit to address is a few more levels deep.


ranjithduraisamy72 ‘s recommendation of doing it in Report Designer is an interesting one; I’ve never tried that.  I’ll give it a shot.


arpine08
Jr Varsity I
Forum|alt.badge.img+1
  • Jr Varsity I
  • August 9, 2026

Hi ​@lairdtim,

I found a possible workaround for displaying the data vertically using only a GI.

This could be another option if you'd prefer to keep the solution entirely within a Generic Inquiry.

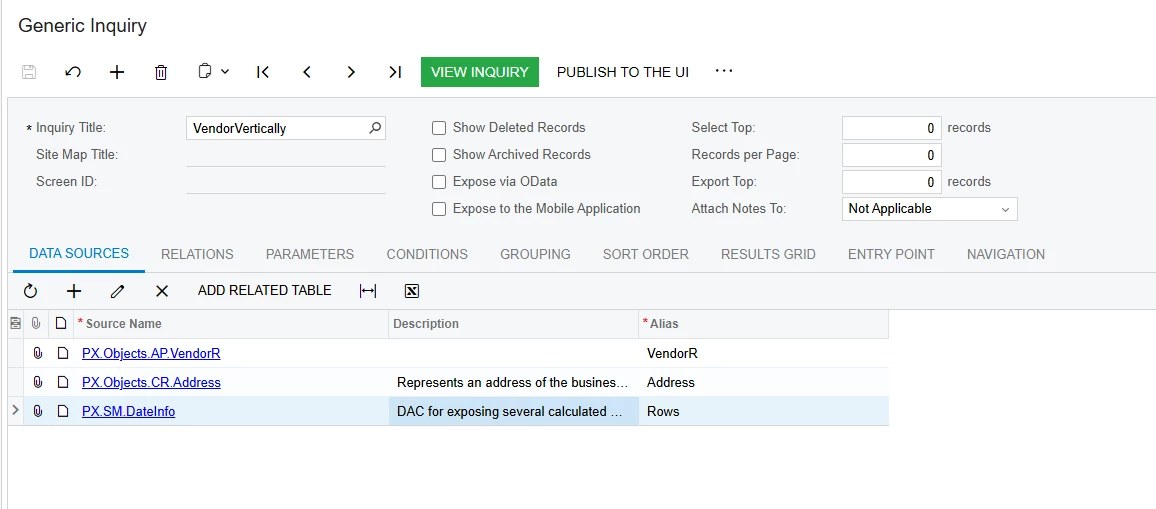
The idea is to use PX.SM.DateInfo as a small row generator. DateInfo is added to the GI using a Cross Join and limited to five records (DateInt from 19700101 through 19700105), one record for each address info field.

The idea of using the DateInfo table came from ​@lauraj46 ( Link: AUG Forums – DateInfo

— thank you, Laura!

The five generated rows are then used with Switch() formulas to return the appropriate Label and Value for each row.

1. Data Sources

Add PX.SM.DateInfo to the existing GI using the alias Rows.

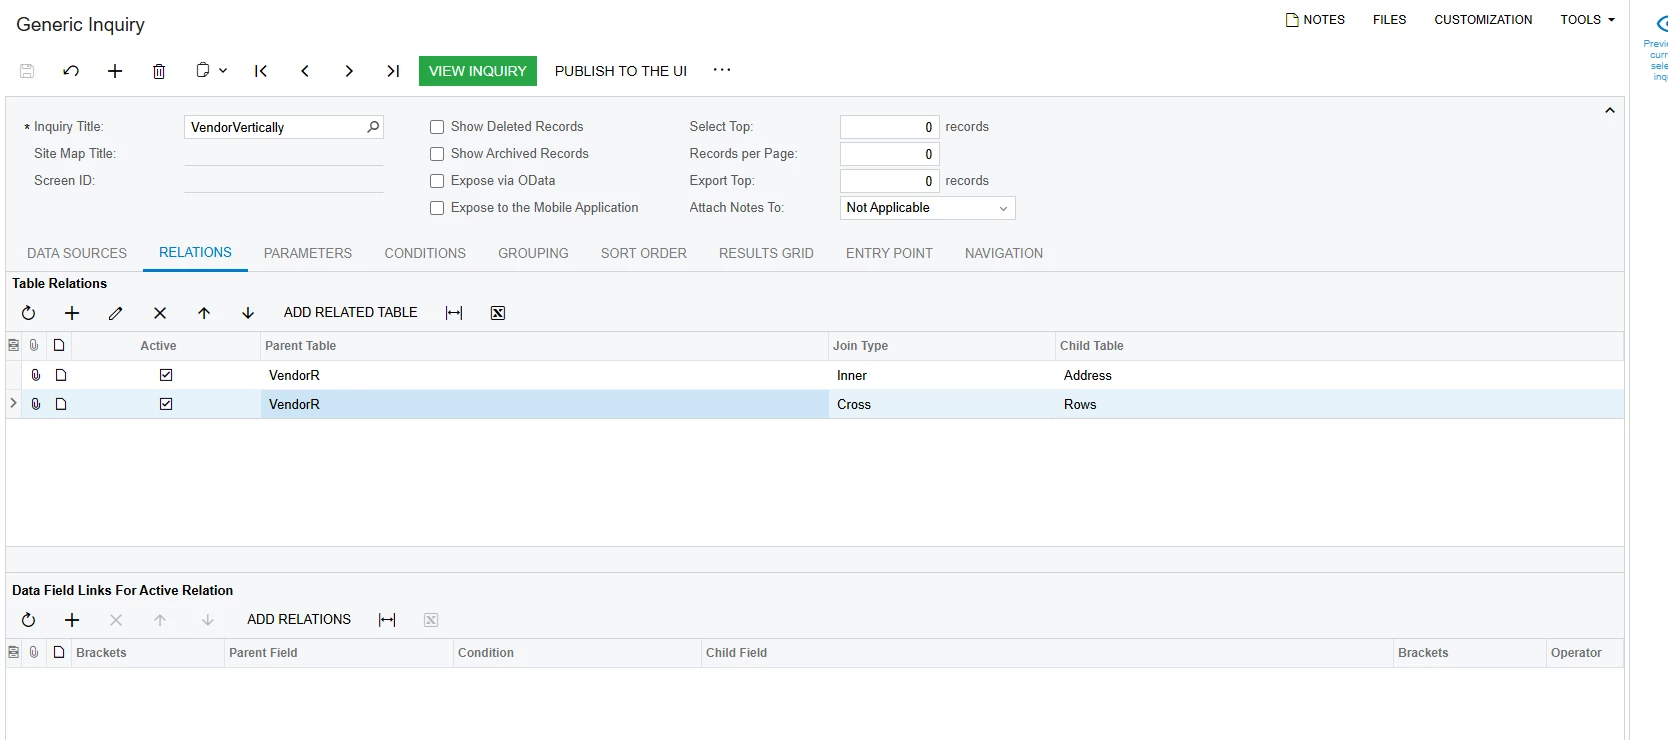
2. Relations
Add Rows using a Cross Join. 

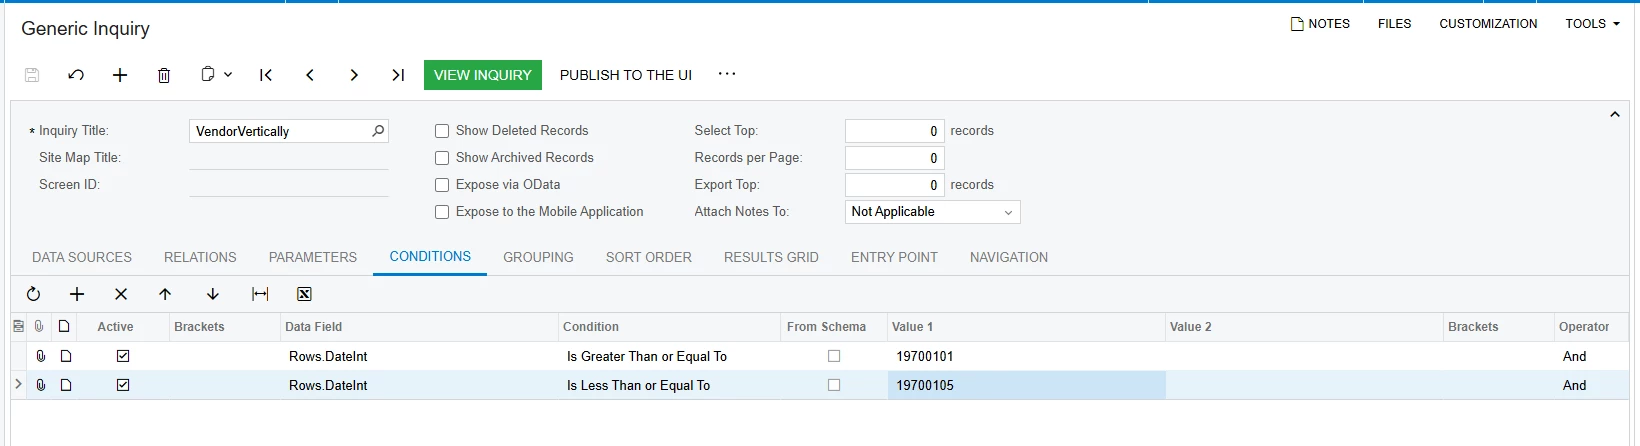
3. Conditions

Limit DateInfo to five records: Rows.DateInt >= 19700101 and Rows.DateInt <= 19700105

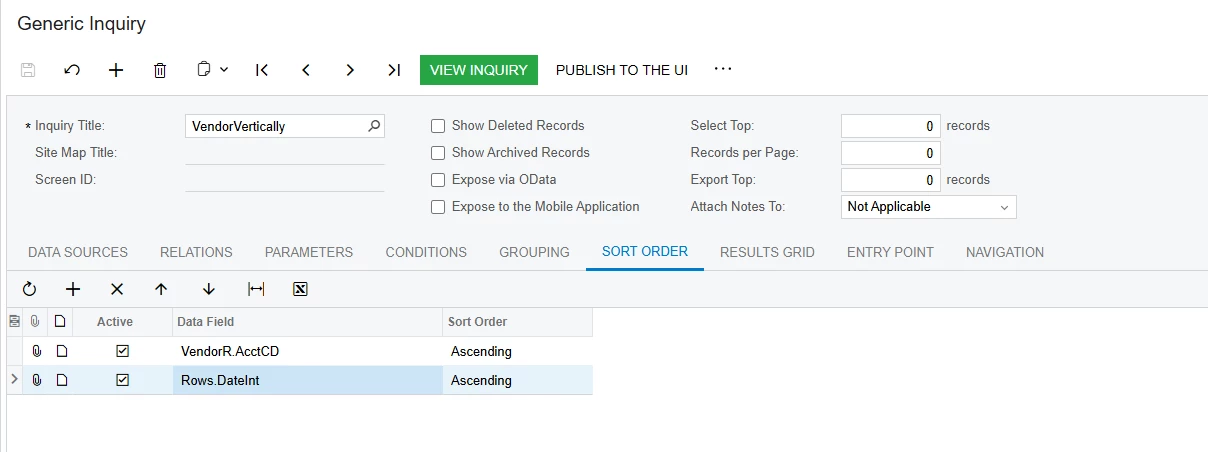
4. Sort Order

Sort Rows.DateInt ascending so the address info fields are always displayed in the intended order.

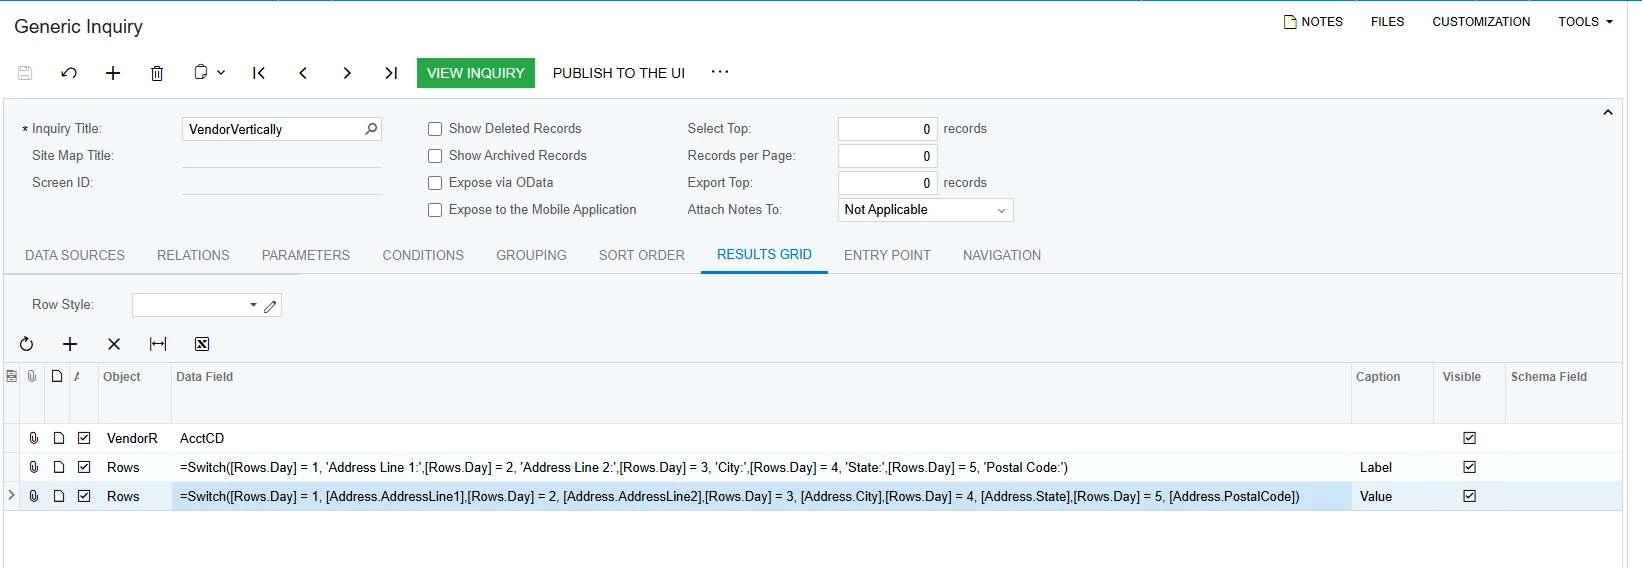
5. Results Grid

Add two calculated fields, Label and Value. Both use Switch() based on Rows.Day to select the corresponding address label and value.

Label:

=Switch([Rows.Day] = 1, 'Address Line 1:',[Rows.Day] = 2, 'Address Line 2:',[Rows.Day] = 3, 'City:',[Rows.Day] = 4, 'State:',[Rows.Day] = 5, 'Postal Code:')

Value:

=Switch([Rows.Day] = 1, [Address.AddressLine1],[Rows.Day] = 2, [Address.AddressLine2],[Rows.Day] = 3, [Address.City],[Rows.Day] = 4, [Address.State],[Rows.Day] = 5, [Address.PostalCode])

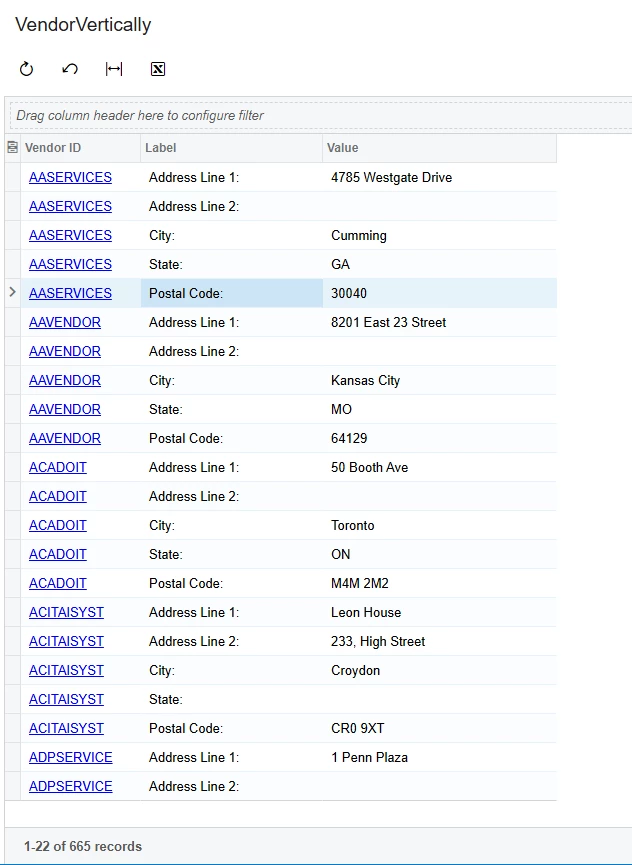
Result: the address info fields are displayed as rows instead of columns.

Note: Your existing GI can keep its own joins, parameters, and conditions, ...; the DateInfo Cross Join is only being used to generate the five rows needed for the vertical presentation.