Question

Excel formatting issues when downloading GI Pivot Table with multiple row groups

  • September 25, 2026
  • 9 replies
  • 54 views

I’m creating a Pivot Table from a Generic Inquiry and I have multiple rows included. In this example, I’m just pulling the Employee, Project, and Time Entry and mashing them together so we have a report that shows Employee totals and Employee Project totals. It looks and works great.
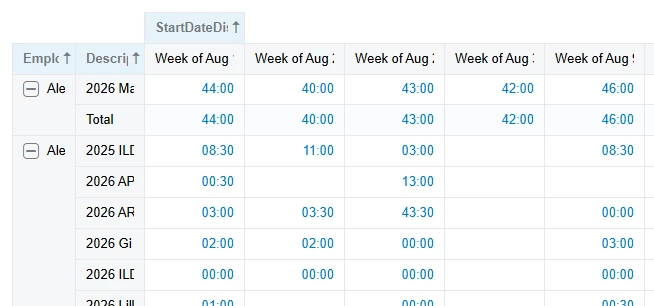


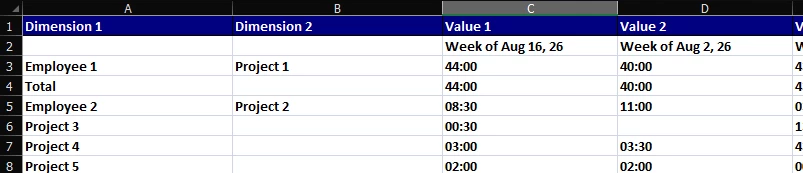
But the problem is when you export to Excel and it looks not so great. The second column moves over to the blank column when the name doesn’t show (names and project names replaced with generic data). Is there any way to stop this from happening?


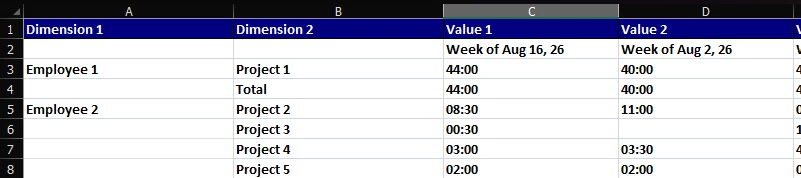
I would expect it to look more like this considering this is how it looks in the pivot table:


Anyone have any suggestions? Or is this just a bug?

Editing to add a quick note: I could do this in Report Designer with a Tabular Report which downloads nicely to Excel, but then I can’t have a total on the far right side.

9 replies

Gabriel Michaud
Captain II
Forum|alt.badge.img+12

If your team has a Velixo license, a good option is to pull the Generic Inquiry directly into Excel using the =GI() function, and then build a native Excel PivotTable on top of that data.

Here’s a demo:

There’s also a setting now to automatically refresh the PivotTable whenever you change any of the filters.

For heavy Excel users, this works really well because they can refresh the underlying Acumatica data without having to re-export and reformat the report every time. You also get access to all of Excel’s native PivotTable layout and formatting capabilities, which gives you a lot more control than the built-in pivot export.

Another option is to connect Excel directly to the GI using Acumatica’s built-in OData endpoint and PowerQuery. That works too, although you don’t get the same ability to dynamically pass your Excel filters back to the Generic Inquiry, and if you have single sign-on enabled I don’t think it works with Excel PowerQuery.

.


  • Author
  • September 25, 2026

I appreciate it, but I’m just trying to understand why Acumatica’s export to Excel process doesn’t work the way I would expect it to. I don’t feel like purchasing outside software should be a necessity for something this simple.


bwhite49
Captain II
Forum|alt.badge.img+12
  • Captain II
  • September 25, 2026

I appreciate it, but I’m just trying to understand why Acumatica’s export to Excel process doesn’t work the way I would expect it to. I don’t feel like purchasing outside software should be a necessity for something this simple.


You will need to solve this with GI grouping - so basically turning the GI into a pivot table instead of using pivot tables. 

There is a lot that Acumatica pivot tables could do better. One area as you are encountering is having control for how it gets exported to excel. 


  • Author
  • September 25, 2026

I appreciate it, but I’m just trying to understand why Acumatica’s export to Excel process doesn’t work the way I would expect it to. I don’t feel like purchasing outside software should be a necessity for something this simple.


You will need to solve this with GI grouping - so basically turning the GI into a pivot table instead of using pivot tables.

There is a lot that Acumatica pivot tables could do better. One area as you are encountering is having control for how it gets exported to excel. 

The reason I’m doing a pivot table is because there is a date range, so there could be any number of columns for the week. Is there a way to do that through a GI without using their pivot table feature? (edit: apologies as that was not clear in my original post that I have a dynamic number of columns)


Gabriel Michaud
Captain II
Forum|alt.badge.img+12

Unfortunately, I don’t think you’re missing a setting here. Report Designer has controls specifically for Excel output, including Manual Excel Mode, where you can control how the report maps into Excel cells. Generic Inquiries and Pivot Tables don’t have an equivalent option that lets you control the layout of the exported Pivot in that way.

So for the specific layout you’re trying to achieve, I’m not aware of a built-in setting that will make the Excel export mirror what you see on screen. I’m also not sure whether Acumatica considers this particular behavior a bug or simply a limitation of the Pivot export. I’d definitely suggest posting it in the Product Ideas section of the Acumatica Community. This seems like a very reasonable expectation for the built-in export.

And if someone knows of a native workaround I’ve missed, I’d be interested in learning about it too.


  • Author
  • September 25, 2026

Unfortunately, I don’t think you’re missing a setting here. Report Designer has controls specifically for Excel output, including Manual Excel Mode, where you can control how the report maps into Excel cells. Generic Inquiries and Pivot Tables don’t have an equivalent option that lets you control the layout of the exported Pivot in that way.

I would create this in Report Designer if I could, but Tabular reports within Report Designer do not work with Manual Excel Mode. It actually doesn’t look terrible when doing that in Report Designer and downloading to Excel (weird merged cells aside), but we need a Total on the right side which we can’t do with Tabular. So I can export to Excel nicely with Report Designer but not include a total on the right, or do this in a GI and it looks bad when downloading to Excel. I can’t get both at the same time.


bwhite49
Captain II
Forum|alt.badge.img+12
  • Captain II
  • September 25, 2026


I would create this in Report Designer if I could, but Tabular reports within Report Designer do not work with Manual Excel Mode. It actually doesn’t look terrible when doing that in Report Designer and downloading to Excel (weird merged cells aside), but we need a Total on the right side which we can’t do with Tabular. So I can export to Excel nicely with Report Designer but not include a total on the right, or do this in a GI and it looks bad when downloading to Excel. I can’t get both at the same time.

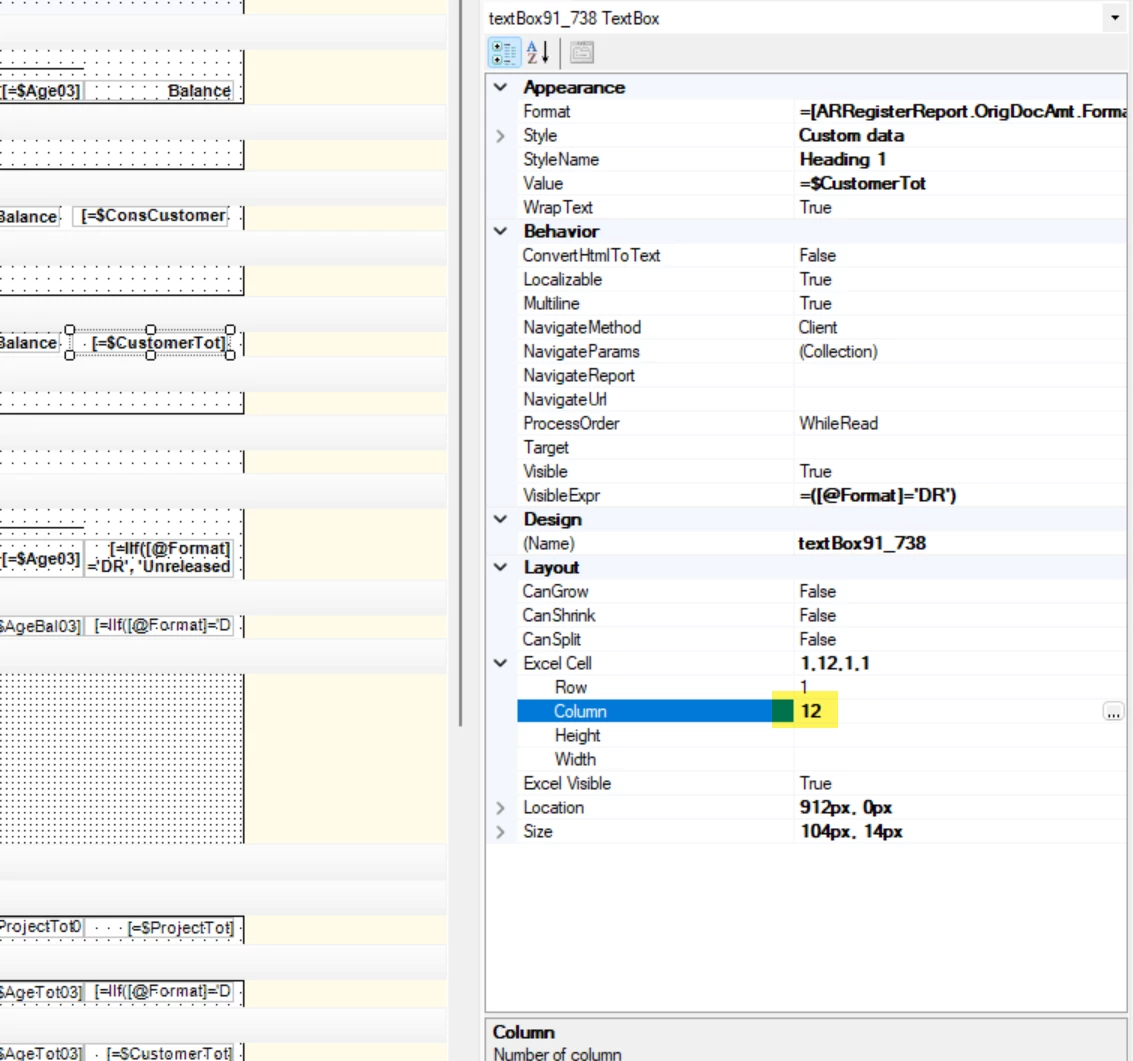
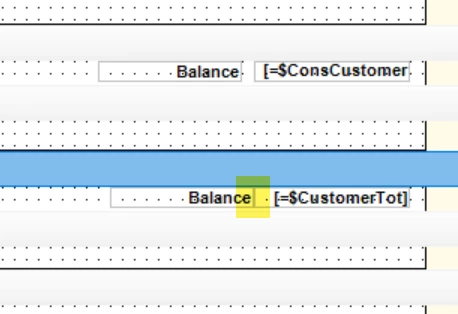
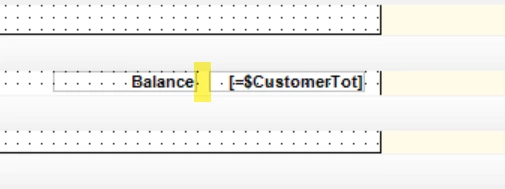
For report designer field merging, the below screenshots typically resolve that. These are

  1. Assigning an excel column to the field
  2. Removing spacing in the document
Column #
Good


Bad


Regarding the specific formatting. I’m thinking you could probably achieve with a sub report. You could embed the tabular data into a sub report within your report and then show the totals on the right side, but I’m not sure how well that would work without trying.


bwhite49
Captain II
Forum|alt.badge.img+12
  • Captain II
  • September 25, 2026

Actually, thinking about that further…. I don’t think the sub report will work. Not sure there is a good option here as you say.


  • Author
  • September 25, 2026

Actually, thinking about that further…. I don’t think the sub report will work. Not sure there is a good option here as you say.

I’m guessing there is SOMETHING that could be done, I’m just not sure what that is and it’s likely a little more convoluted than should be. I really was hoping there was something I was missing when exporting the GI pivot tables to Excel. It’s a very structured data set and should translate nicely to Excel, so I’m just not sure I understand why it does what it does.