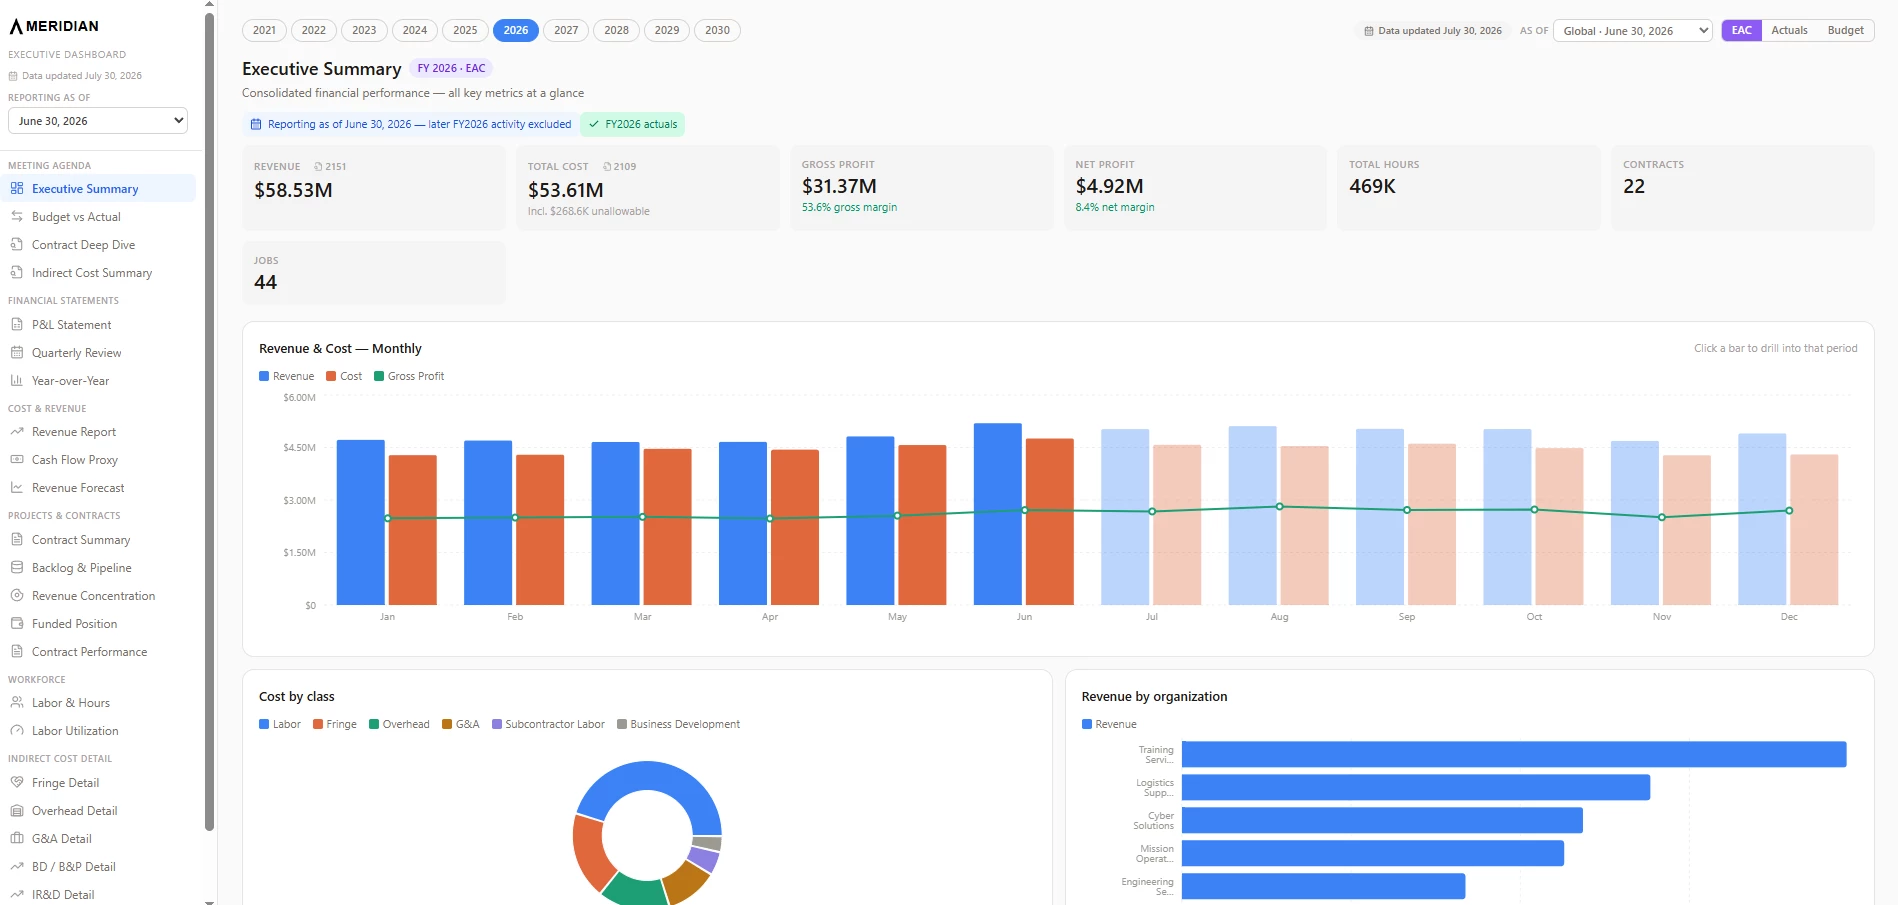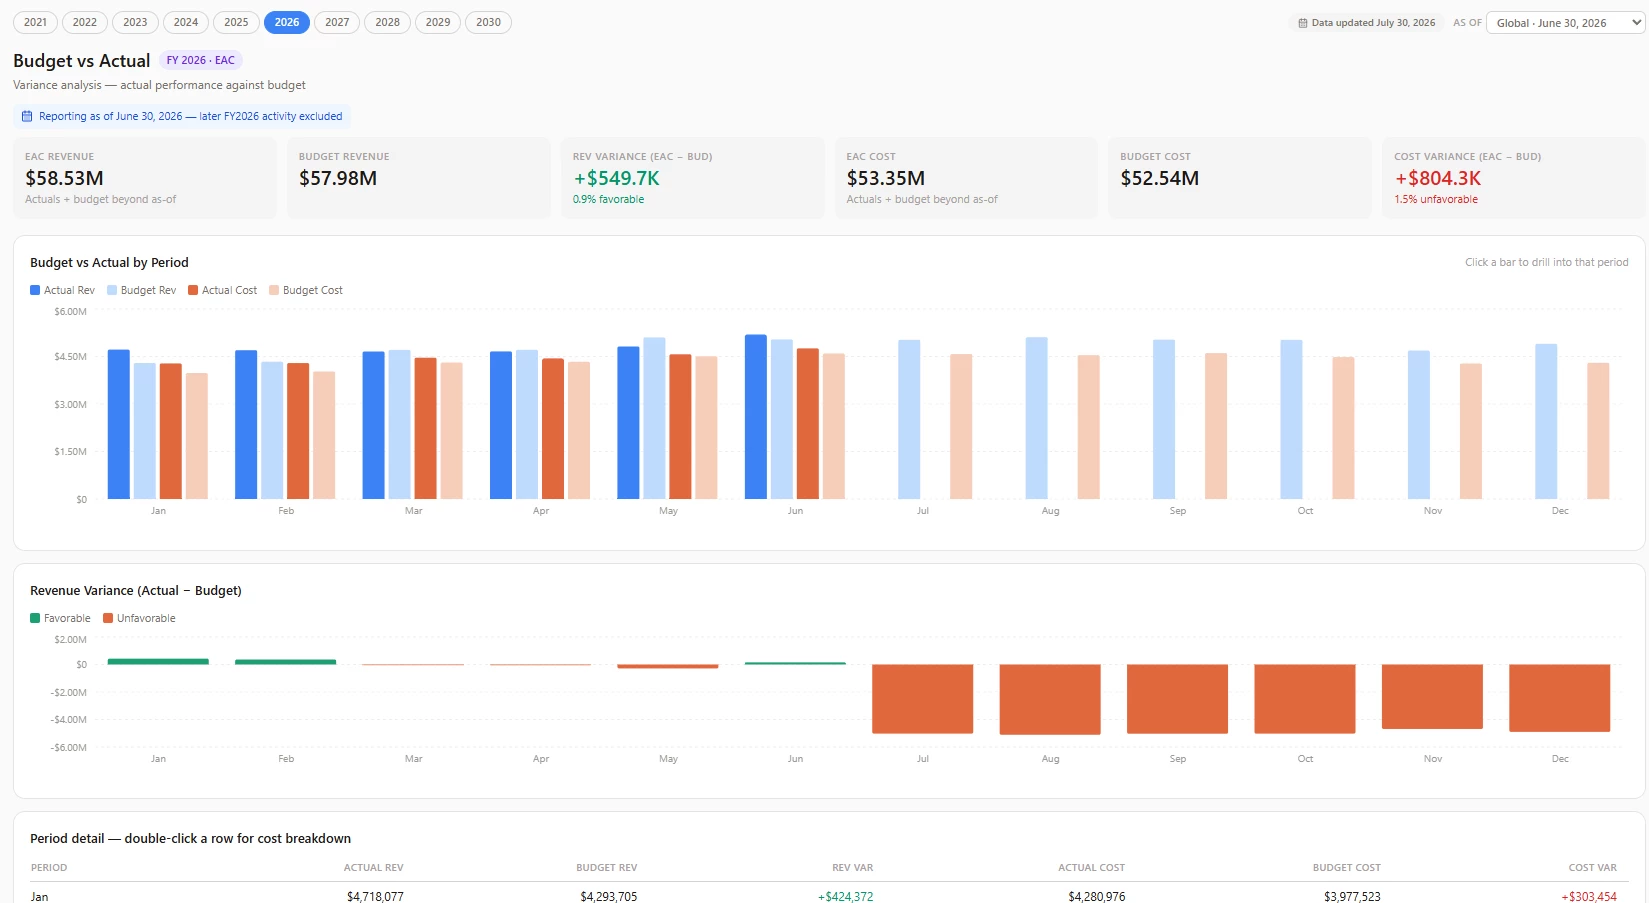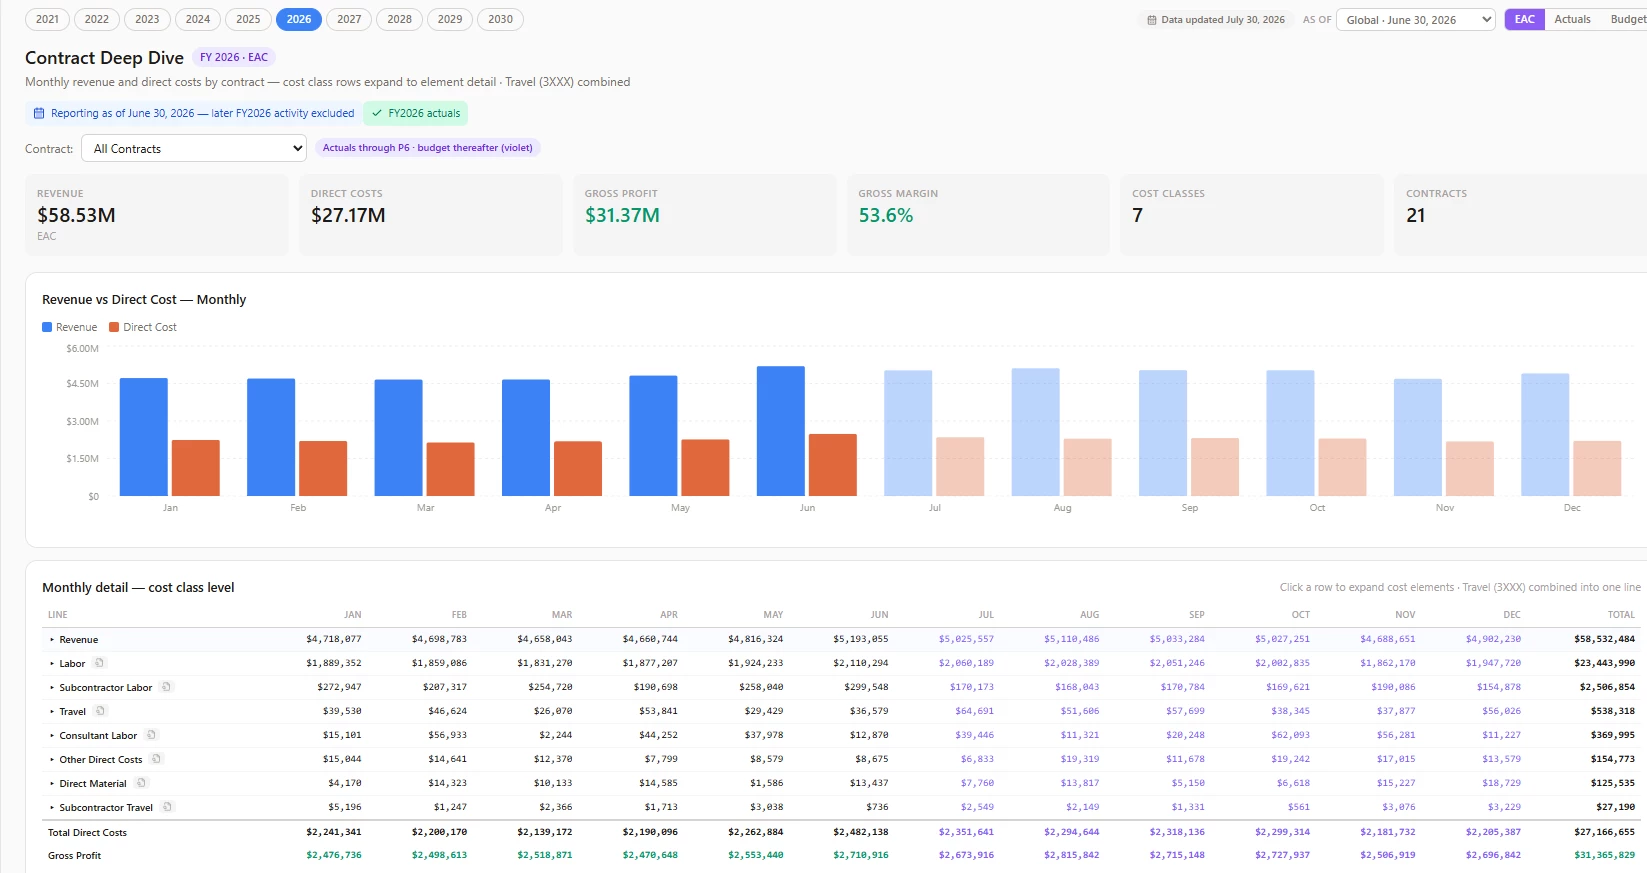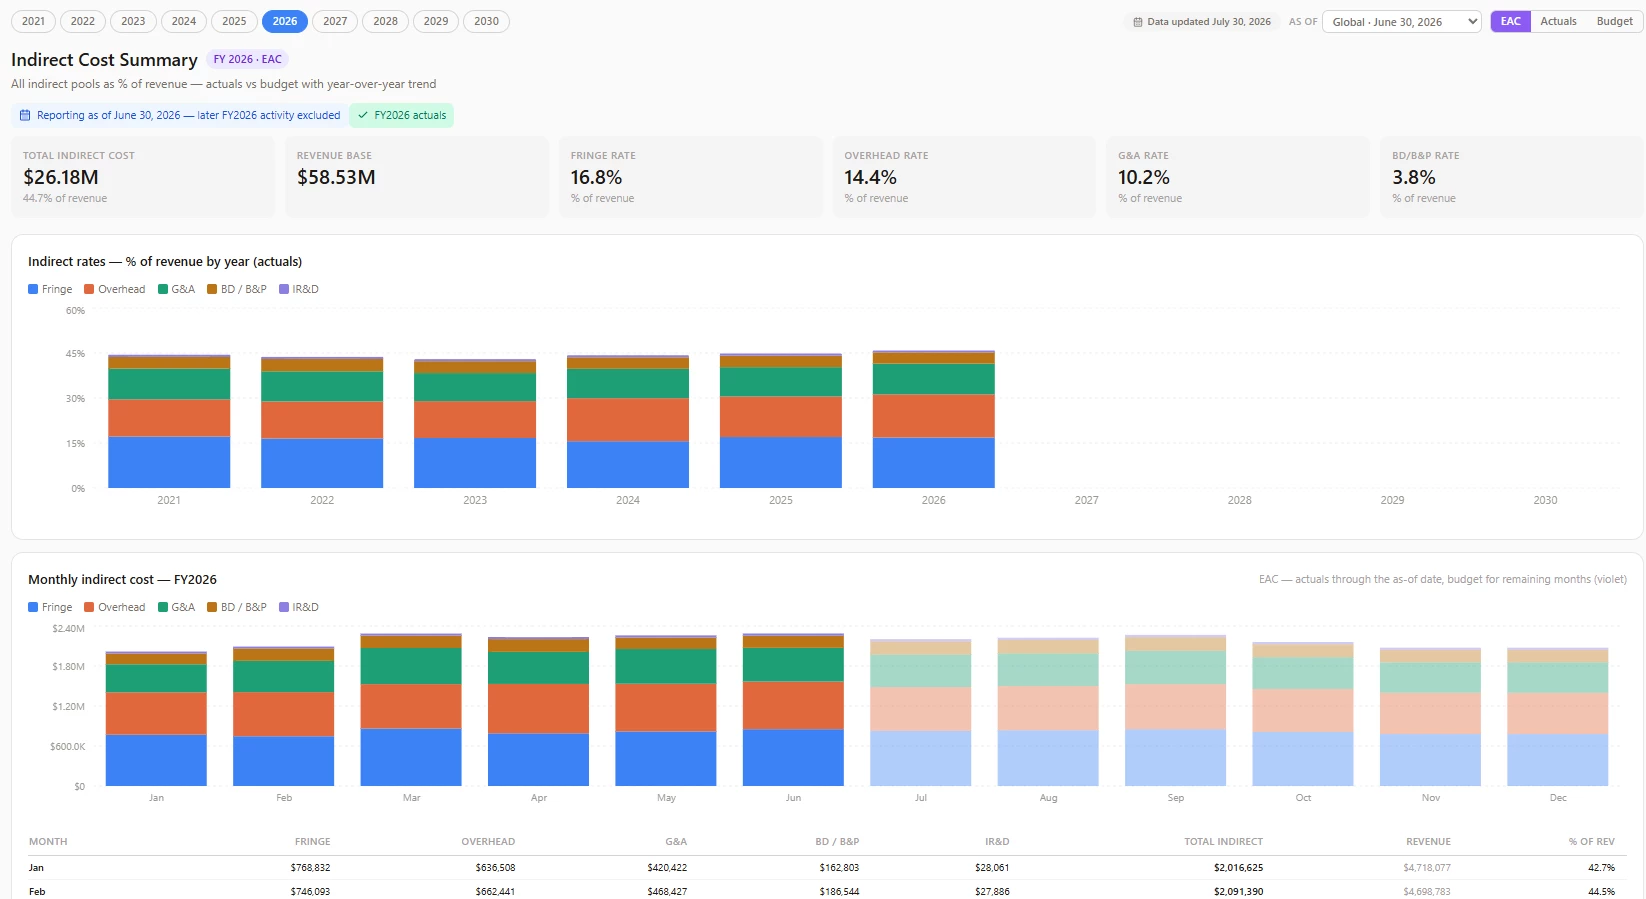

My favorite phrase in my line of work now is “If you give an executive a dashboard”...Just a playful take on the famous children’s book, “If you give a mouse a cookie”. I am not disparaging the desire for data from executives, their jobs require access and visibility to the data that matters quickly and completely to support decision making. I made a post about a year ago about an Executive Dashboard that I put together inside of JAMIS, and I still think that dashboard was a great step in the right direction and a slick integrated solution inside of JAMIS. But it was limited in its drill down function, and didn’t load instantly. When you have inquiries that pull from multiple tables, especially Business Planning tables, they tend to run a bit slowly. This, of course, is manageable through refresh schedules and patience. So if you have an internal customer who craves information, but also wants a pretty and snappy interface, then this topic might be for you.
One of the very first and most powerful inquires I recommend for all JAMIS users is a copy of the JCT Detail, with the ability to export to Odata enabled. If you use business planning, then adding in the Forecast (or budget or sandbox) to your inquiry makes it even more powerful. That inquiry runs slow (again pulling from BP), but is the foundation of the ability to make great pivots and get to information at the lowest possible level. Essentially, you are using excel as your data warehouse and then coming up with your own data visualizations by the means of pivots and excel based graphs/charts. This is great for some users, and all that you might ever need. However, if you crave more, let AI enter the chat.
Disclaimer: JAMIS offers a data warehouse and reporting solution which is turn key and they will implement for you. The purpose of this is for those “do-it-yourselfers” who like to play around and are often gluttons for punishment.
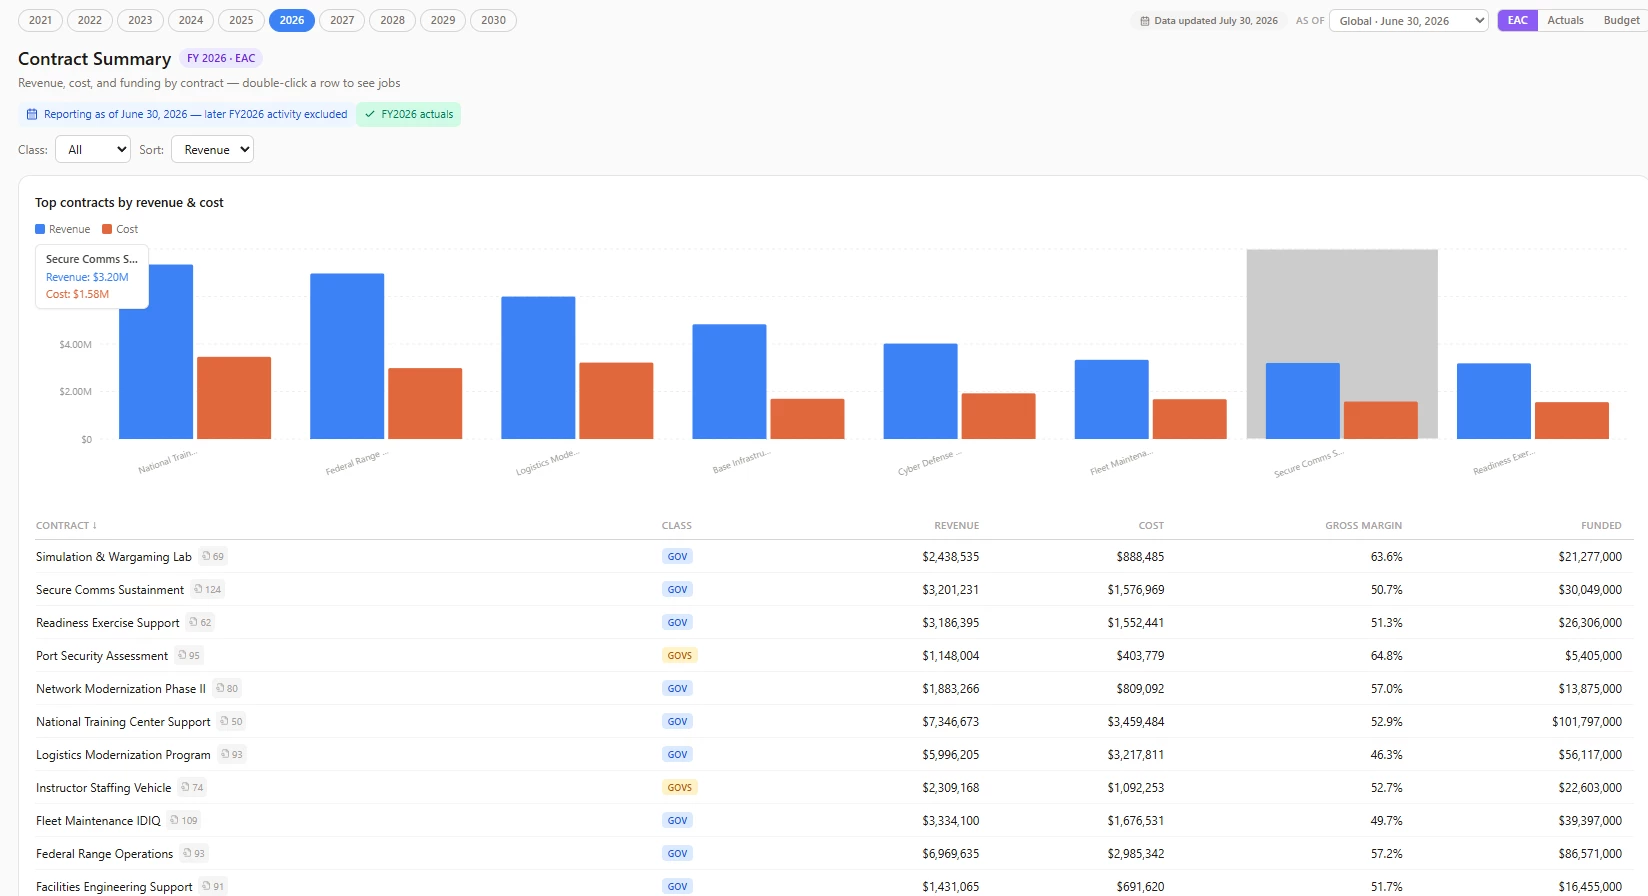
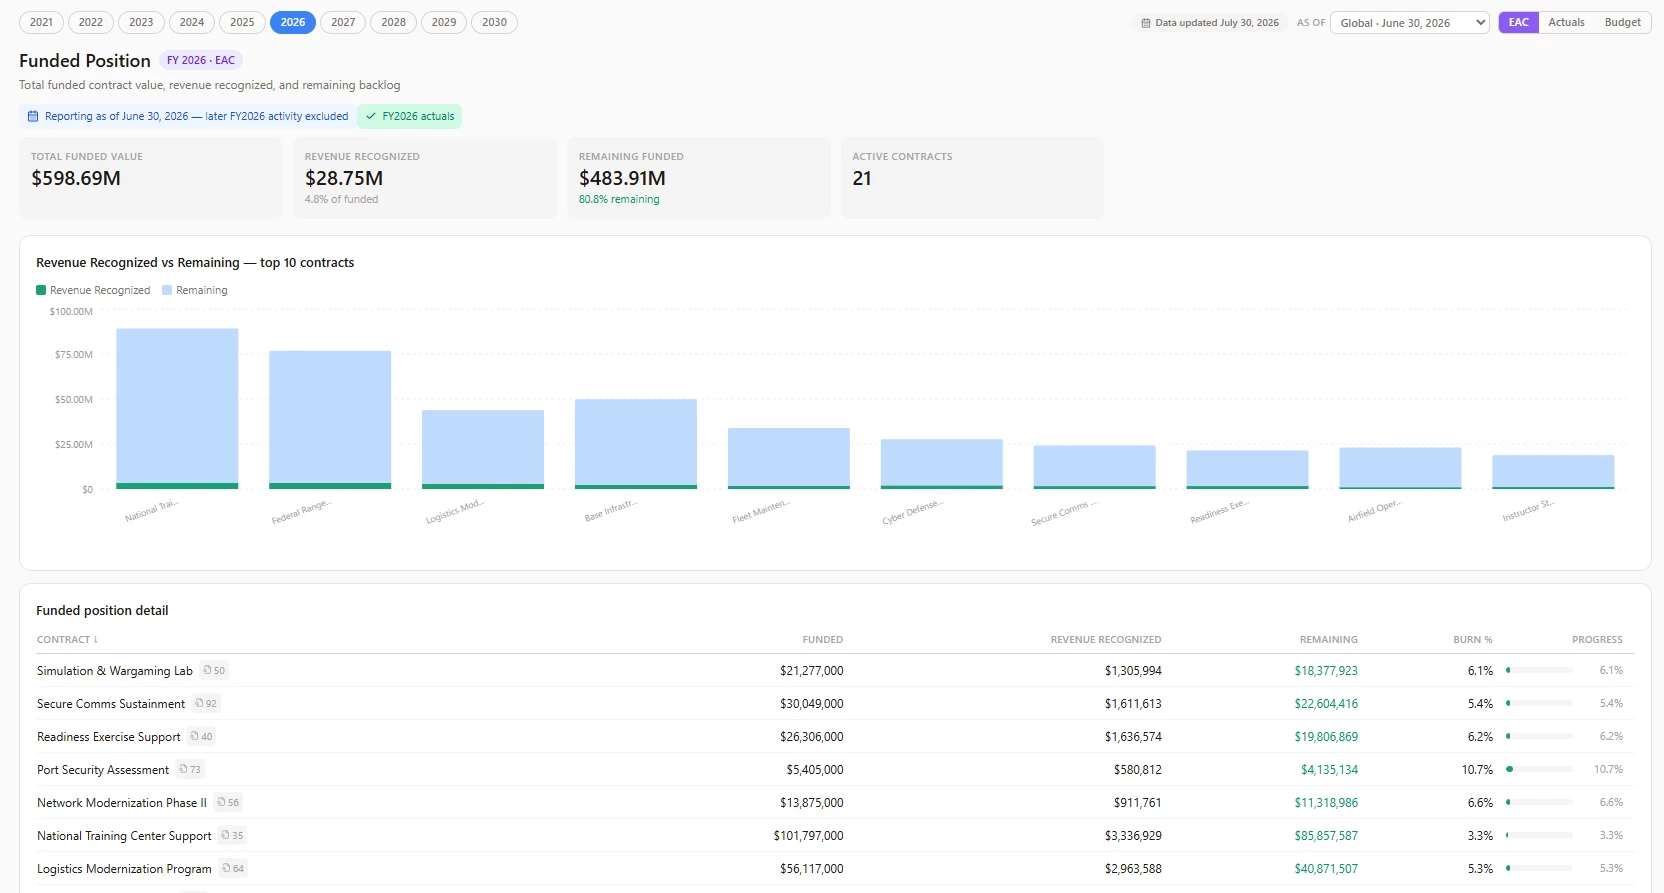
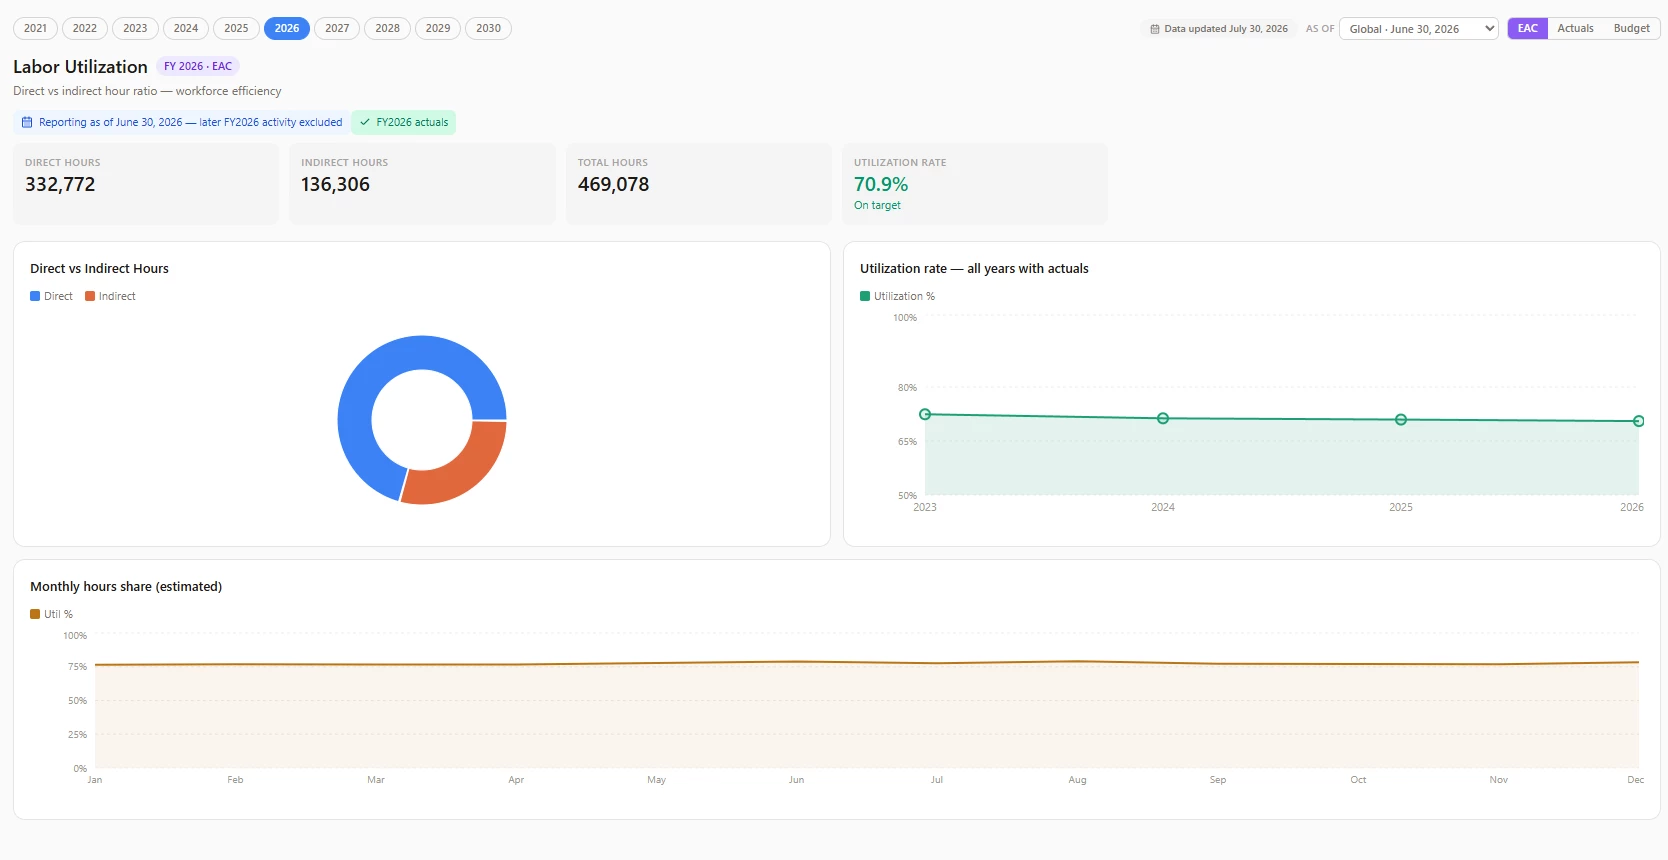
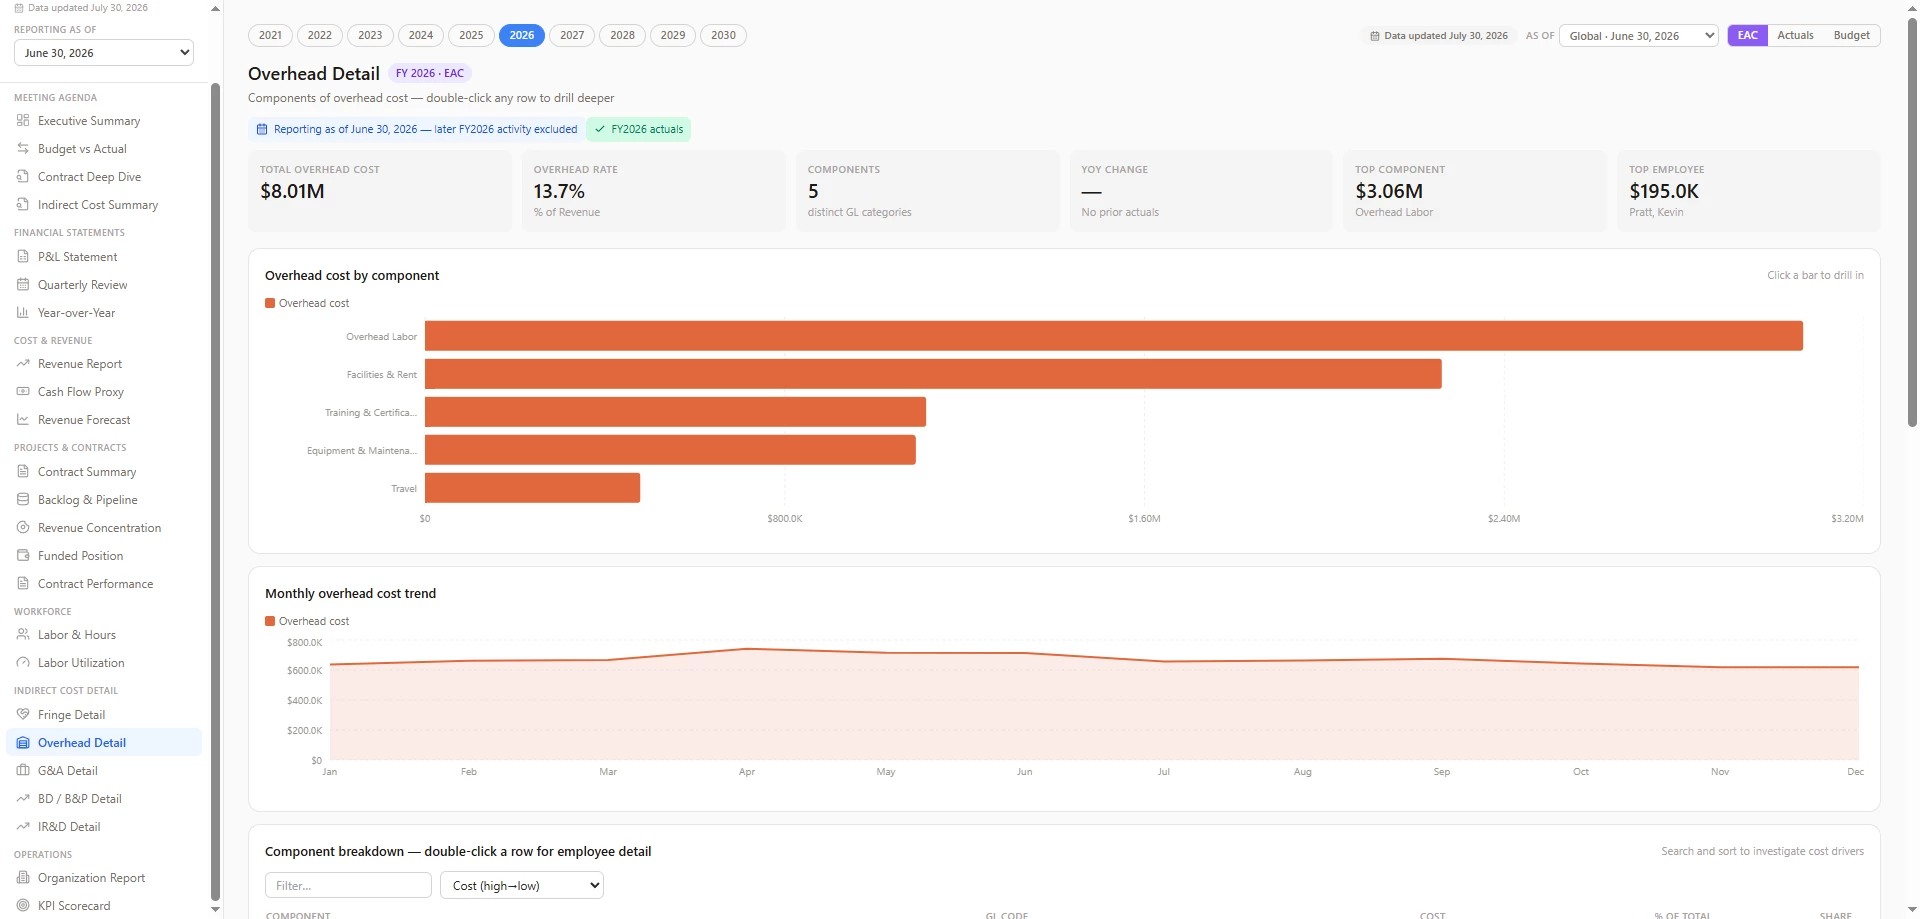
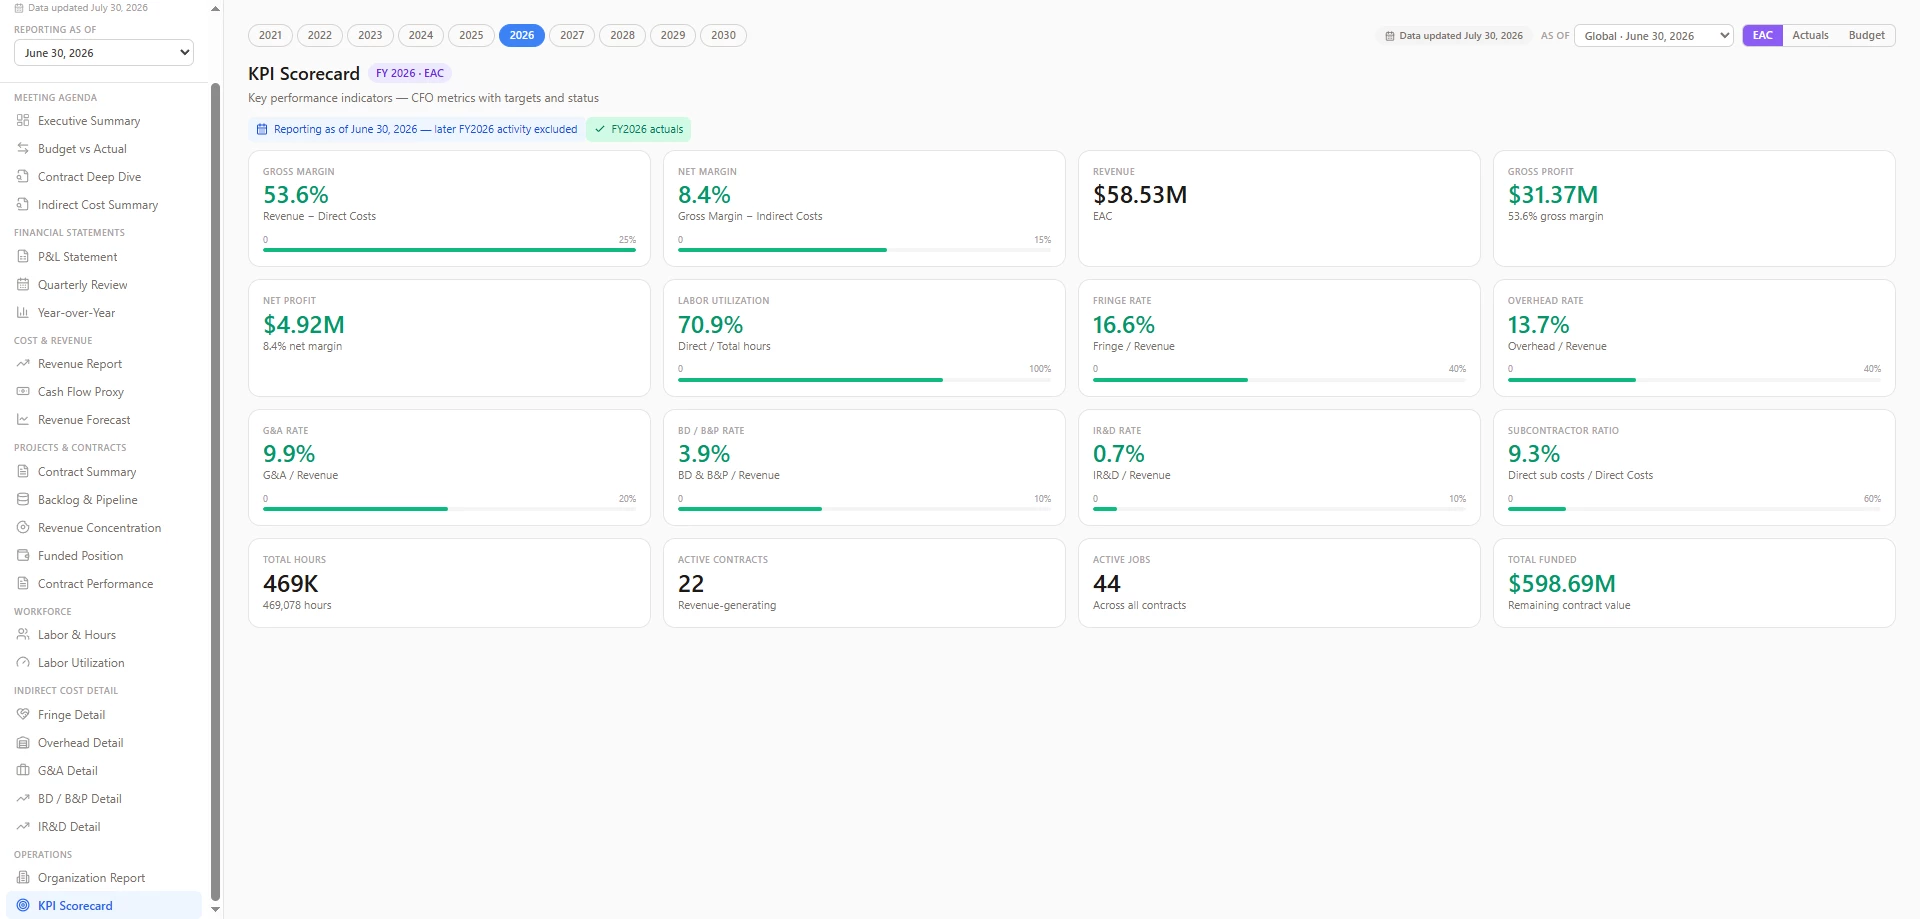
Using Claude cowork with lots of prompting, reworks, validations, and reconciliations to ensure data integrity, I had it design an HTML dashboard for my executive users. I store this html site on our existing SharePoint file infrastructure, with the trace file stored in the same location so it can be linked for data drill downs. This is not the only way, but definitely the simplest. Below I have attached some screenshots of a fictional company Meridian so I don’t need to redact information. Also, I have linked the entire fictional company html dashboard and trace file to this post that you can download and play with to get an idea of the functionality. If you like it, you can drop the file into your AI solution and have it use that as a template for your company or as a starting point for a discussion about what things are important for your executives to see.
Link to download dashboard: Sample Company Dashboard Link (let me know if you can’t access)
Here are some key features that I think are super valuable:
- This is a full executive finance platform — 25+ dashboards — built conversationally, starting from nothing but the raw job-cost + forecast export from JAMIS. No BI platform, no licenses, no IT project, no data warehouse. The entire thing compiles to a single HTML file hosted on SharePoint, Azure, or open from a desktop.
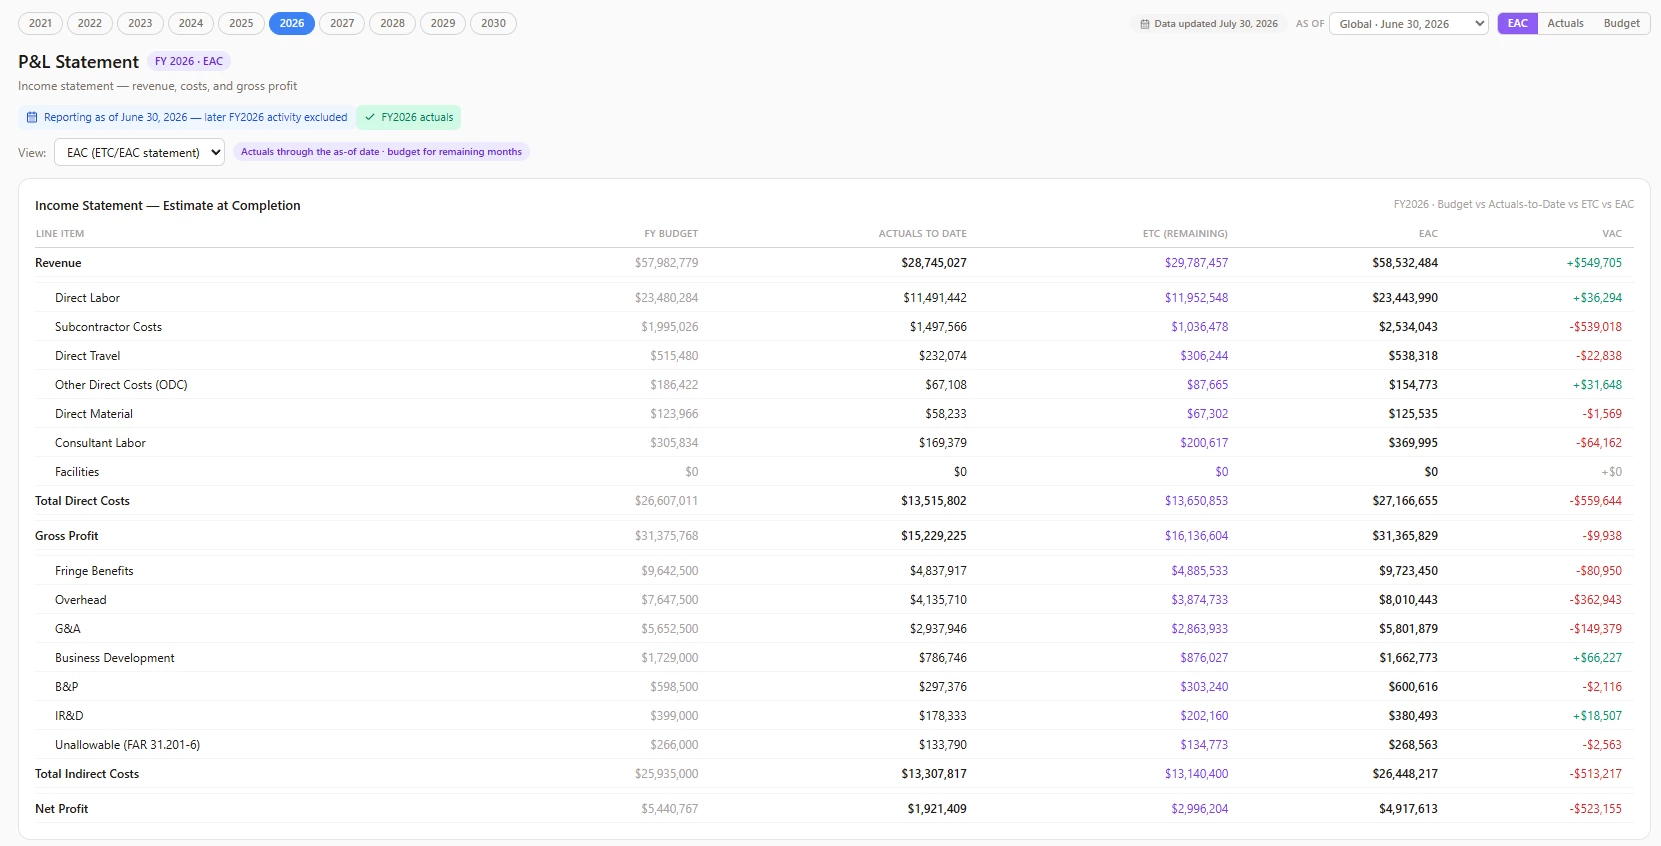
- This dashboard has a "reporting as-of" concept: you declare the last closed month, and every page reports through that cutoff, with later months explicitly flagged interim.
- The default view is EAC — actuals through close, plan for the remaining months — with a Budget / Actuals-to-Date / ETC / EAC / VAC income statement. Variance conversations now happen against where we'll land, not where we've been.
- Every number drills to source. Click any tile or line and you get the underlying transaction rows from the export — with row numbers, so you can Ctrl+G straight to the transaction in the spreadsheet. Employee and vendor names included. Getting the details to tie exactly (milestone revenue elements, unallowables, budget rows in the drill-downs) was honestly where most of the real work went, and it's what made the exec team trust it.
- I organized the left hand menu so that I can have a focused view for my monthly meeting agenda, but the rest is always available for people who want more detail.
- It opens and loads instantly.
Here are some notes and suggestions from my use case that increase efficiency:
- Split data imports, I created multiple inquiries of the JCT Detail + Forecast data to reduce the load time and file size. I loaded in historical data which was a one time import from closed years, and then used parameters to reduce the scope of the inquiry to the current year and forecast. This reduced the excel odata load time from 10+ mins to just under 2 mins.
- I update the dashboard using Claude once a week, which is now a process that takes less than 5 mins from the time I hit data refresh to having an html site to uploaded to SharePoint
- There are no restriction groups, so share your data with the right audience only.
- If you use the SharePoint file explorer feature, where you store a copy locally, the trace data is available by navigating to location of unzipped trace file when the site prompts you to do so.
Screenshots: