Solved

Perfomance metrics.

  • May 25, 2026
  • 3 replies
  • 39 views

Hi everyone, could you share your experience on how to find performance issues? For example, code logging, it could be event logs or method logs. Also sometimes I encounter high wait times and I don't know what it is and what could be causing it.
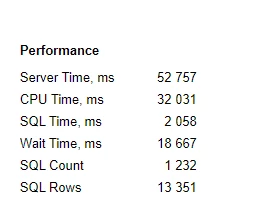
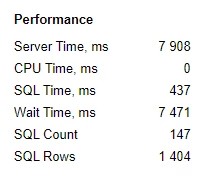
Example of high wait time
This one is more  stranger thatn first one.

Please share your expericence, i will be very appriciated.
Best answer by Takisawa

@RohitRattan88 Thanks for answer.
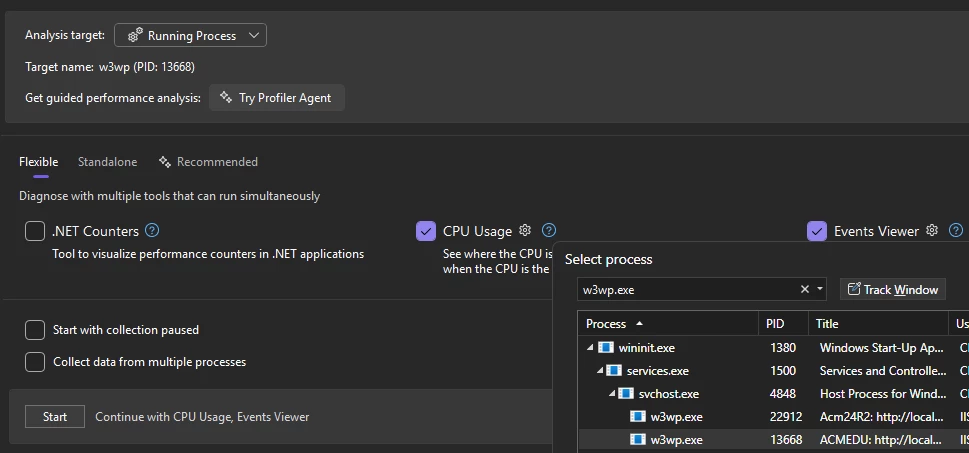
I solved this issue. I used Visual Studio profiler, to understand, where is a hot place in my code. It`s userful thing. 

Maybe my short guide will help someone.


Step 1 Configure profiler

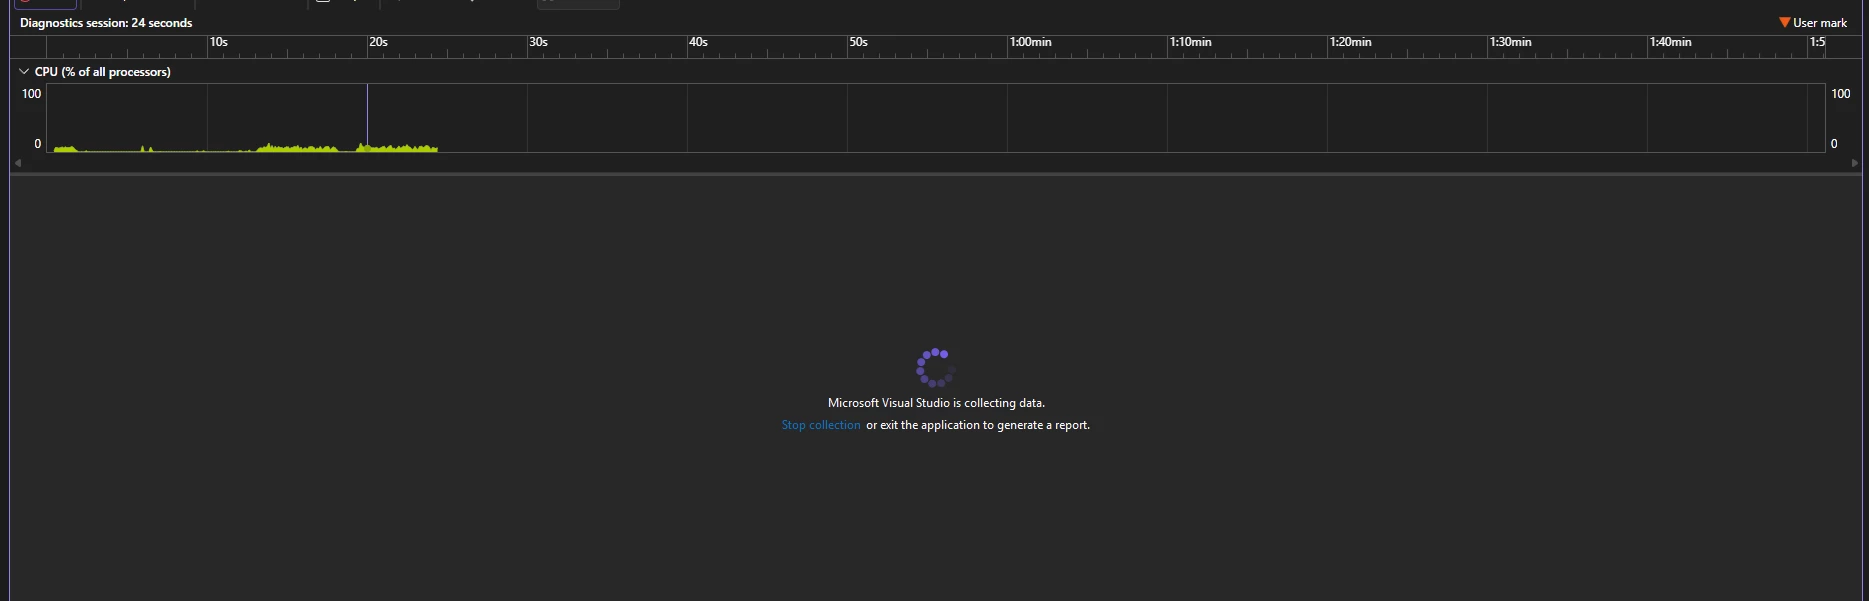
after that perform any actions, fill fields, reload page etc.

as you see here i have done 2 actions
​​​​​
​​

After that press “Stop Collection” and wait. Once VS end processing you can switch to Flame graph view, and check where is your bottlenecks.

In my case, i found place which i moved to slots mechanism and i got 2 sec instead of 22 sec.

Hope this will help someone!


3 replies

RohitRattan88
Acumatica Moderator
Forum|alt.badge.img+4
  • Acumatica Moderator
  • May 26, 2026

@Takisawa , generally

Server time = CPU time(code execution) + SQL time(self-explanatory) + Wait Time(could be anything really, e.g. external application calls, booting application….)

You could utilize request profiler to investigate issues: Step 2: Investigate Application Server Time and Database Server Time in the Request Profiler

You could write trace from your code for logging: To Write to the Trace Log from the Code

Refer to documentation for available troubleshooting tools: Troubleshooting Customization

Hope it helps


  • Author
  • Freshman II
  • Answer
  • May 27, 2026

@RohitRattan88 Thanks for answer.
I solved this issue. I used Visual Studio profiler, to understand, where is a hot place in my code. It`s userful thing. 

Maybe my short guide will help someone.


Step 1 Configure profiler

after that perform any actions, fill fields, reload page etc.

as you see here i have done 2 actions
​​​​​
​​

After that press “Stop Collection” and wait. Once VS end processing you can switch to Flame graph view, and check where is your bottlenecks.

In my case, i found place which i moved to slots mechanism and i got 2 sec instead of 22 sec.

Hope this will help someone!


RohitRattan88
Acumatica Moderator
Forum|alt.badge.img+4
  • Acumatica Moderator
  • May 27, 2026

@Takisawa 

Great. Thank you for sharing your solution.