Perfomance metrics.

  • May 25, 2026
  • 1 reply
  • 19 views

Hi everyone, could you share your experience on how to find performance issues? For example, code logging, it could be event logs or method logs. Also sometimes I encounter high wait times and I don't know what it is and what could be causing it.
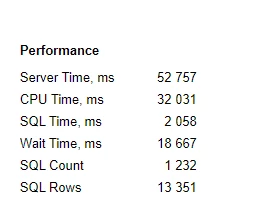
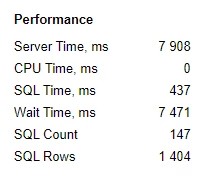
Example of high wait time
This one is more  stranger thatn first one.

Please share your expericence, i will be very appriciated.
1 reply

RohitRattan88
Acumatica Moderator
Forum|alt.badge.img+4
  • Acumatica Moderator
  • May 26, 2026

@Takisawa , generally

Server time = CPU time(code execution) + SQL time(self-explanatory) + Wait Time(could be anything really, e.g. external application calls, booting application….)

You could utilize request profiler to investigate issues: Step 2: Investigate Application Server Time and Database Server Time in the Request Profiler

You could write trace from your code for logging: To Write to the Trace Log from the Code

Refer to documentation for available troubleshooting tools: Troubleshooting Customization

Hope it helps