Answer

Sales and Profitability Report Group by Parameter

  • March 26, 2025
  • 3 replies
  • 104 views

Forum|alt.badge.img+3

Hi All, I have a bit complex task assigned to me.

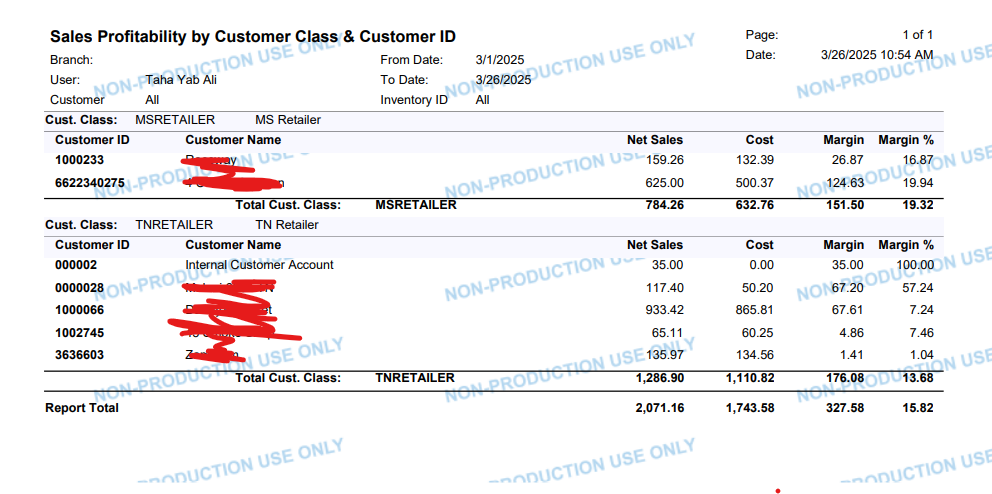
I'm working on customizing a report in Acumatica Report Designer  Sales Profitability by Customer Class report. I want to add a GroupBy parameter that allows grouping the data by Weekly, Monthly, Quarterly, Yearly, or 5-Year periods. Like if Select the Quarterly it should the prior 3 months data and it should be visible inside report too. Any Idea on how to this task? 

Any help would be great.

Thanks

Best answer by bwhite49

I agree with ​@BenjaminCrisman that separate reports or GI filters/pivot filters will probably save some headaches. That is the best route if an option.

If you need to combine this into one report, you can group transactions based on formulas that you will need to write. There already is a table in Acumatica called DateInfo which will create some of these time buckets for you (quarters, weeks, etc.) to assist you in your formula writing.

So start by connecting these invoice/sales orders to the DateInfo table through the doc date field. Then create a combo parameter with these time options as a drop-down selector. From there you will need to write a couple formulas where iif the parameter = week, then group on the week field, else iif parameter is quarter then group on the quarter field, and on and on. 

3 replies

BenjaminCrisman
Acumatica Employee
Forum|alt.badge.img+4
  • Acumatica Support Team
  • March 26, 2025

@tahayabali This seems like it might be difficult to do all within a single report, should these instead be broken out into separate reports? It would seem that even a GI could work better for this since you could have tabs with the data filtered to show these time frames and users can switch between the tabs.

Otherwise I would think that making a subreport for each type of grouping you’re looking to have and an option as a parameter to check which will hide the other subreports and only show the one relative to the parameter selected.

If it all must be done within a single report then maybe the Aging reports can provide some clues how to setup showing different amounts aged to the specified dates and then could display them in columns similar to the aging report.


Forum|alt.badge.img+3
  • Author
  • Captain I
  • March 26, 2025

@BenjaminCrisman Thanks for the reply I am not sure what to do with this. I am not good in reporting. Any suggestion on what works best sub reports or other thing


bwhite49
Captain II
Forum|alt.badge.img+10
  • Captain II
  • Answer
  • March 26, 2025

I agree with ​@BenjaminCrisman that separate reports or GI filters/pivot filters will probably save some headaches. That is the best route if an option.

If you need to combine this into one report, you can group transactions based on formulas that you will need to write. There already is a table in Acumatica called DateInfo which will create some of these time buckets for you (quarters, weeks, etc.) to assist you in your formula writing.

So start by connecting these invoice/sales orders to the DateInfo table through the doc date field. Then create a combo parameter with these time options as a drop-down selector. From there you will need to write a couple formulas where iif the parameter = week, then group on the week field, else iif parameter is quarter then group on the quarter field, and on and on.