I am trying to create an ARM report that gives me monthly expense by GL/Subaccount.
I’m running into an issue that I assume can be resolved. We are still fairly new on Acumatica.
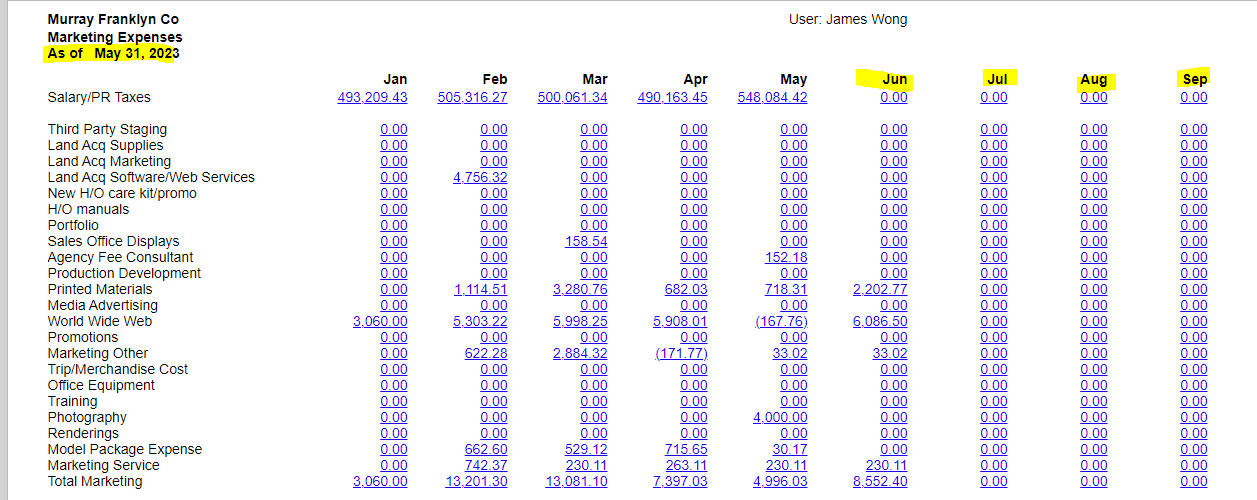
I want to be able to enter the period end/financial period and only populate the columns through that period. As you can see since we have values in June already entered, how do I limit the report to only show values through this period - May 31, 2023.
I’ve created separate columns for each month and used the following as my data source:
Is this best practice for a 12 month period report and how do I limit the report to only show values through financial period entered?
Any assistance would be appreciated.
Best answer by Laura03
Hello,
Here are the examples from the above Acumatica solution:
For every column of the GL type, create a formula in the Visible Formula row with the
code shown in the following examples:
For example:
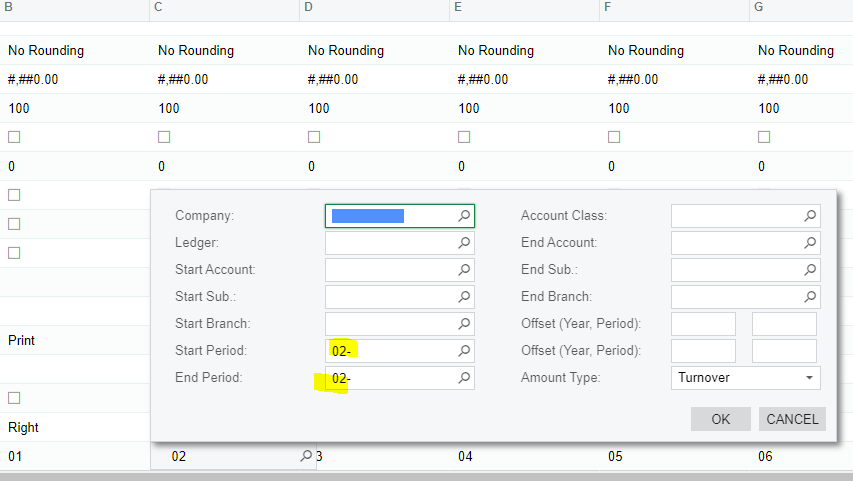
For a column with Start Period = 01-, End Period = 01-, the formula can look like: =iif(Left(@StartPeriod,2)=1 And Left(@EndPeriod,2)>=1, True, False)
For a column with Start Period = 02-, End Period = 02-, the formula can look like: =iif(Left(@StartPeriod,2)=2, True, False)
For a column with Start Period = 03-, End Period = 03-, the formula can look like: =iif(Left(@StartPeriod,2)=3, True, False)
For a column with Start Period = 04-, End Period = 04-, the formula can look like: =iif(Left(@StartPeriod,2)=4, True, False)
Hello, and welcome to Acumatica! Did you notice this previous post with instructions for limiting columns that print on ARM reports using visibility formulas?