Solved

How to create a multi level axis in report designer

  • 22 September 2023
  • 1 reply
  • 39 views

Userlevel 4
Badge +1

Hello everyone,


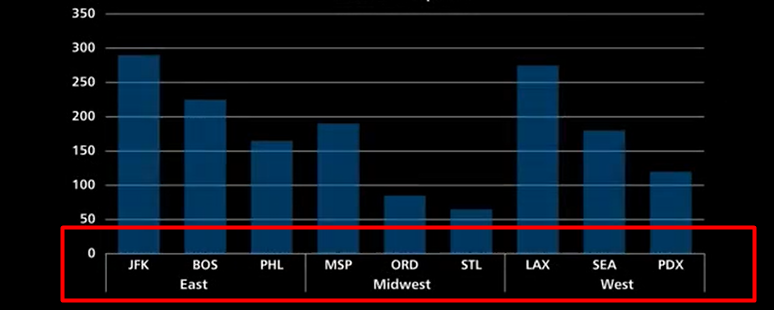
Does any one knows how to create a multi level axis in the report designer? Report designer is adopted from excel. But the charts setting is limited. I want to create a multi level chart that grouped by month and product. Has anyone done this before? Thanks for sharing. 


Excel sample:
 

icon

Best answer by BenjaminCrisman 26 September 2023, 18:26

View original

1 reply

Userlevel 7
Badge +4

@larryly At the moment you can only have one level for the axis, though it does seem like a good idea. I would recommend to make a new one here in the community or vote it up if it already exists.

Reply


About Acumatica ERP system
Acumatica Cloud ERP provides the best business management solution for transforming your company to thrive in the new digital economy. Built on a future-proof platform with open architecture for rapid integrations, scalability, and ease of use, Acumatica delivers unparalleled value to small and midmarket organizations. Connected Business. Delivered.
© 2008 — 2024  Acumatica, Inc. All rights reserved