Solved

Dashoboard: How to overlap display of two trend line graphs

  • October 27, 2025
  • 1 reply
  • 33 views

Forum|alt.badge.img+6

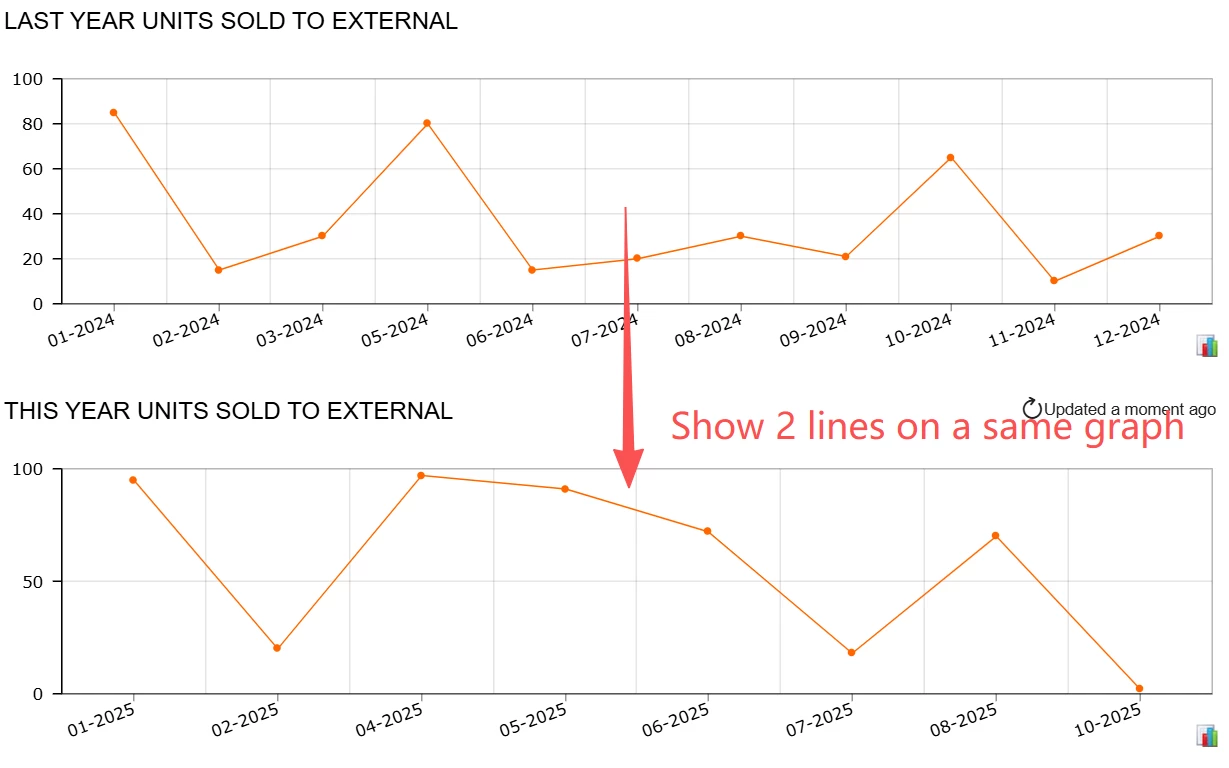
       Can Acumatica support the overlap display of two trend line graphs? Or more specifically, is there a way to achieve the following effect: displaying two lines of different colors on a single graph. Line 1 represents the monthly sales data of 2024, and Line 2 represents the monthly sales data of 2025.

    Like below, I already have 2 separate graphs, can it be shown on 1?


Best answer by bwhite49

You can accomplish with an attribute. You have to have duplicate rows. I described how to accomplish this here...

Dashboard: Sales to date vs last year | Community

1 reply

bwhite49
Captain II
Forum|alt.badge.img+12
  • Captain II
  • Answer
  • October 27, 2025

You can accomplish with an attribute. You have to have duplicate rows. I described how to accomplish this here...

Dashboard: Sales to date vs last year | Community