Solved

Dashboard colunn chart - show months with no data

  • 30 September 2021
  • 1 reply
  • 104 views

Badge

Hi Acumatica community!

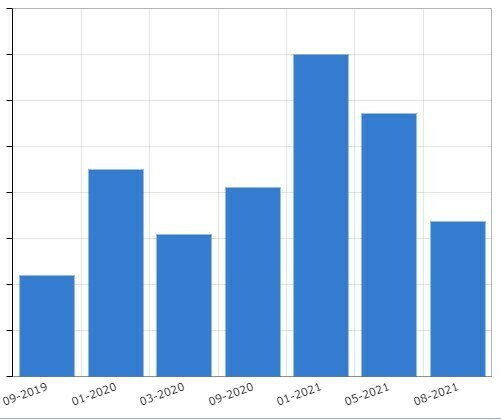
I have a column chart in a dashboard that shows sales by month for individual customers. The column chart only displays months with sales data, which is a problem as many of our customers order every second month or quarterly. See example below.

If there are no sales in a given month, I’d prefer that the chart showed zero (a blank space) for that month. This would make it much easier to see the relationship between sales and time.

Is that possible in Acumatica?


icon

Best answer by BenjaminCrisman 4 October 2021, 17:17

View original

1 reply

Userlevel 7
Badge +4

Hi @peterj23 ! Usually for these types of requests, because the ARInvoice table doesn’t hold data for periods where there was no activity, you’ll need to join in ARHistoryByPeriod and make sure to display all periods even if there is no activity, then the widget will pick up this information.

https://help-2021r1.acumatica.com/(W(797))/Help?ScreenId=ShowWiki&pageid=546521ef-49a4-198f-36b4-5073cefa16b6

“If some financial period does not have any transactions, the historical record will not be created for that period. In order to get the historical balance for such period you need to join the last historical record to the desired period. In reports, it is done with BaseARHistoryByPeriod, which is a business query language (BQL) projection.”

There is an example of joining to HistoryByPeriod table in the GL DAC overview:


Reply


About Acumatica ERP system
Acumatica Cloud ERP provides the best business management solution for transforming your company to thrive in the new digital economy. Built on a future-proof platform with open architecture for rapid integrations, scalability, and ease of use, Acumatica delivers unparalleled value to small and midmarket organizations. Connected Business. Delivered.
© 2008 — 2024  Acumatica, Inc. All rights reserved