I have a need that I think is quite simple but I can't figure out how to do it. 
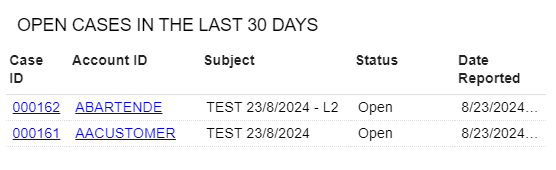
I want to have a line chart that shows the total count of open cases(CR3060PL) over a period (eg: the last 30 days).
So X = dates and Y = total count of open case at the given date
I want to be able to see if there is a trend. Can someone show me how to do it?
Thanks
Page 1 / 1
Hi @raphrf
You create a Widget like below:
FILTER SETTINGS:
The result is as follows:
Best Regards,
NNT
Hi @raphrf
You create a Widget like below:
FILTER SETTINGS:
The result is as follows:
Best Regards,
NNT
Hi , thanks for the answer, but my question maybe wasn't clear, i would like to have a "line chart"
Hi @raphrf
The way to do it is the same as above.
Best Regards,
NNT
Hello,
If a Case is closed now but was open on August 1, should it be counted in the August 1 open case figures when the GI is displayed today?
Most GI’s will show Case status “as of now” and not work back automatically to show a different status as of a certain day.
If the answer to my question above is Yes, a case that is closed today should appear in open counts for earlier days when it was still open… I think it will be difficult but not impossible, to show case status “as of another day” using opened and closed dates on the cases, with the start date/end date parameters of your GI. Possibly. I can’t suggest any calculations but more clever members of this community might be able to help further.
Laura
the point you mention is what I feared and did not see how to do, but I imagine that it is a common need to see the trend over time, and that since reporting is a strength of Acumatica, so that it is possible?
Hi @raphrf were you able to find a solution? Thank you!