@bpgraves,You don’t need to open a full Acumatica source project to remote debug.
Since Acumatica is already running on IIS on the server, remote debugging typically involves attaching your local Visual Studio to the IIS worker process (w3wp.exe) on that server.
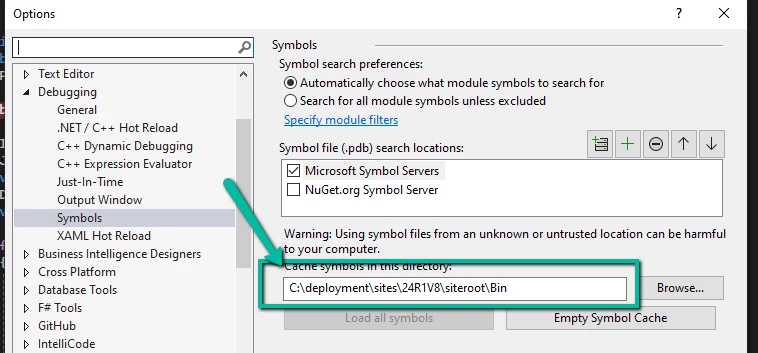
If you are working with a customization library project, open that project locally (the one that produced the deployed DLL), make sure it was published in Debug mode and that the .pdb file is present in the site’s bin folder. Then:
-
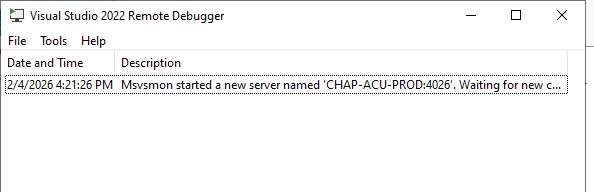
Start msvsmon on the server (which you’ve done).
-
In Visual Studio → Debug → Attach to Process.
-
Select the remote server and attach to w3wp.exe.
-
Reproduce the issue in the browser to hit breakpoints.
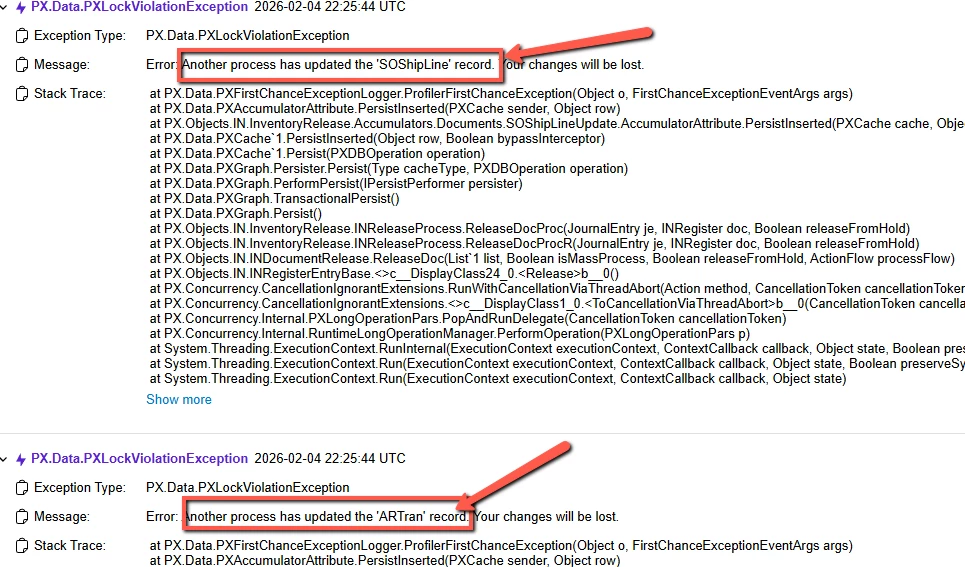
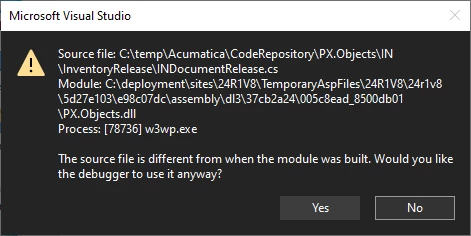
If the stack trace is pointing into PX.Objects core classes, you won’t be able to step into that unless you have Acumatica source and matching symbols. Remote debugging is most helpful when verifying whether your customization logic is contributing to the lock violation (for example in Persist overrides, event handlers, or accumulator usage).
For PXLockViolationException specifically, it’s often related to concurrency (row timestamp mismatches, multiple updates to the same record, long operations, etc.), so inspecting cache state and tstamp values during debugging can help narrow it down.