Hello!
I’ve made a GI (attached) that I think is really neat, and is helping my team find anomalies in raw material usage.
Context:
We’re a process manufacturing company that produces some regulated liquid products. Because of this, traceability on raw materials is key.
Our company requires reporting on the yield percentage of raw material lots we use in production, and the percentage of what we produced was sold.
We only use one Warehouse and Branch, but have multiple locations to manage Quality Control holds and Quarantine. We use the Lot and Serial Tracking feature.
We had an issue where users couldn’t confirm how a lot was zero’d out when inventory was completed. Sometimes users consumed exactly the amount of stock items that we had received. But other times our inventory count was off because vendors over/under shipped an item and we wouldn’t know exactly how much of a liquid was in a container until it was empty. If a lot had zero quantity, it was removed from the Inventory Summary page, and was hard for users to trace how it was used.
The GI:
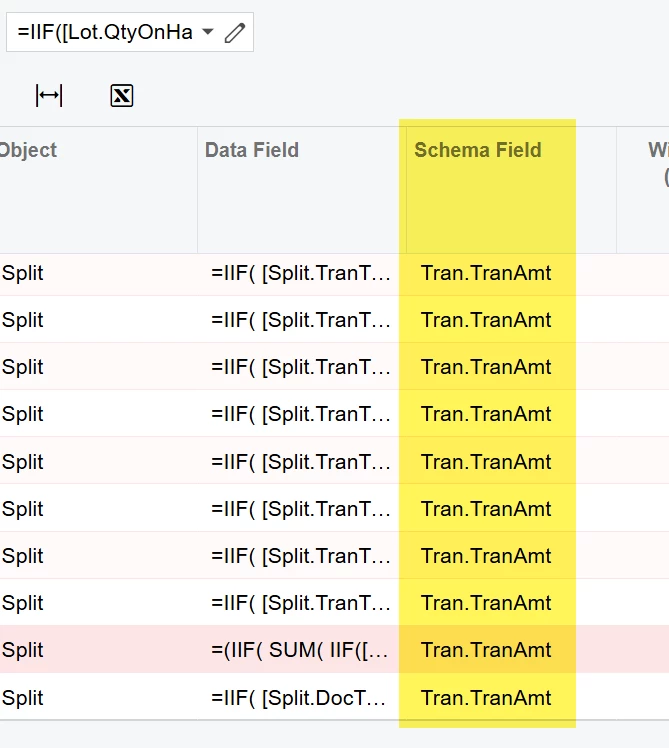
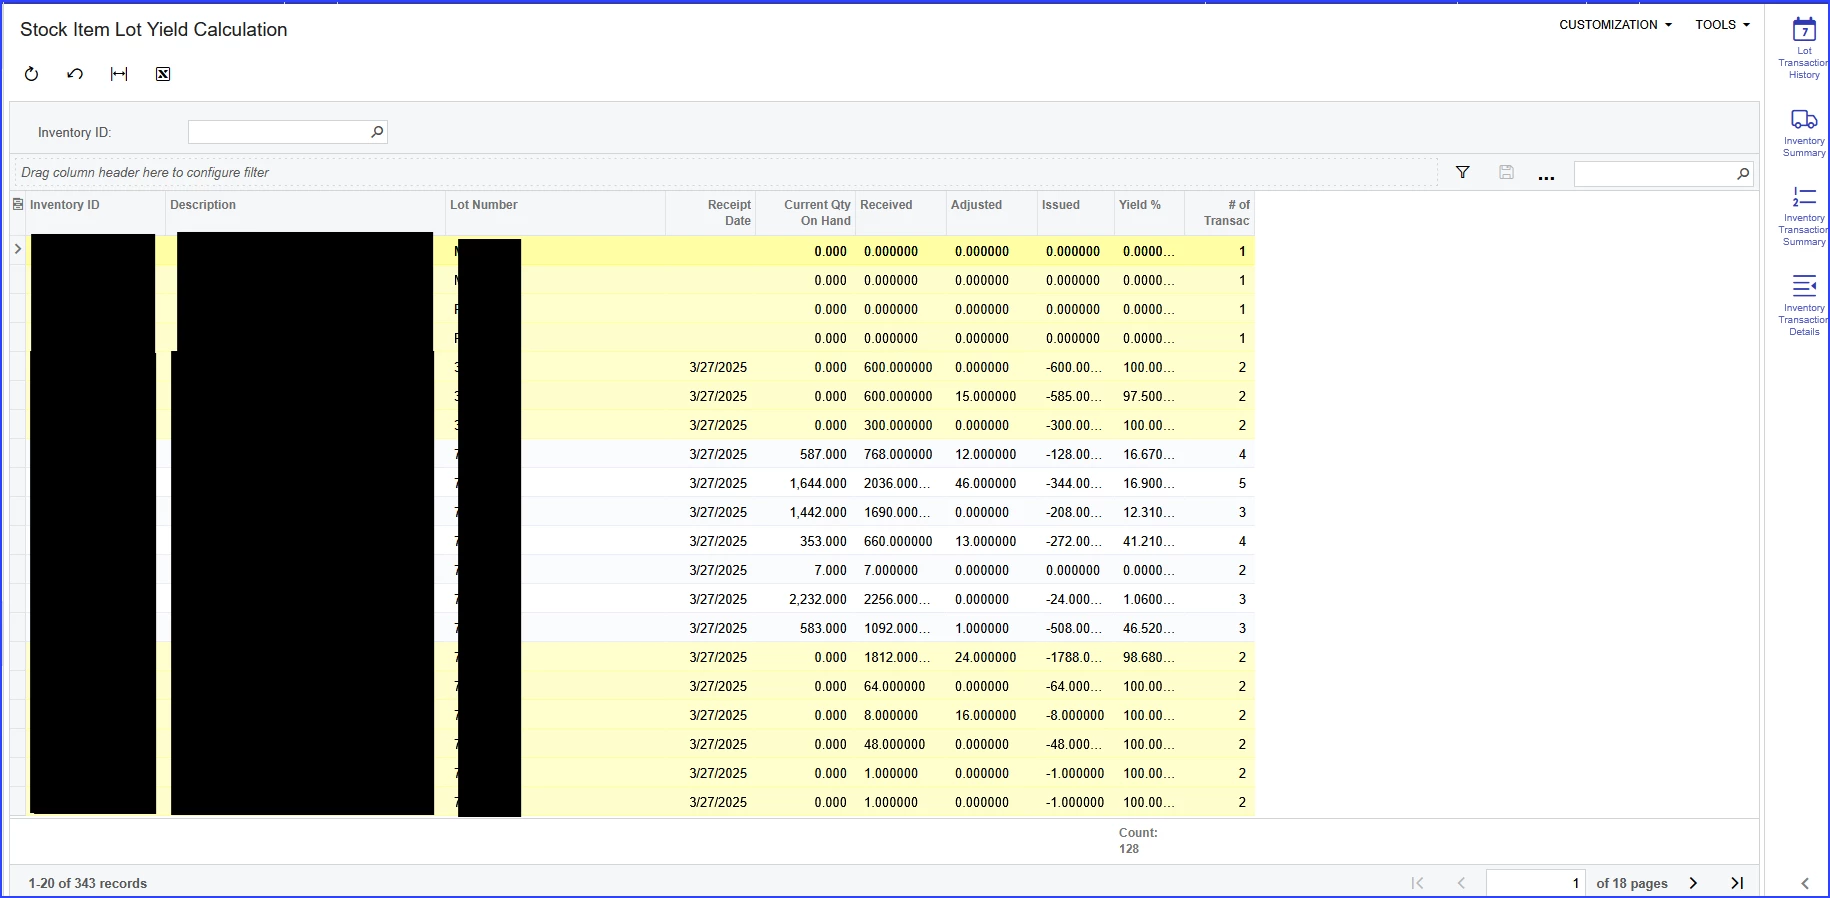
I’ve created a GI table displays every lot of every stock item, and can be filtered by stock item. We have the initial receipt date, followed by our current quantity on hand across all locations. Next we have a column for the initial amount we received of the product. Then a sum of all adjustments, then a sum of all issue transactions. Next, a Yield % calculation that divides the sum of issued quantity by the sum of received quantity, and multiplies it by 100 for a percentage value.
Lots with a current quantity on hand of zero are highlighted yellow so they stand out.
This can be filtered by the Inventory ID condition. Initially I had it only load by inventory ID but users requested it load everything. Currently it is sorted by Receipt Date.
I’ve also added other columns for other transaction types and left them deactivated because we won’t use them.
I’ve also linked the Lot Transaction History, Inventory Summary, Inventory Transaction Summary, and Inventory Transaction Details pages on the side bar, with the selected line details filled in.
Requests:
If anyone can help with the following I would be very grateful.
- I’d like a conditional format on the Yield % field. If the Current Qty on Hand is 0 and Yield % is within 97-103%, format it with =’green20’. If it is outside of that range, format it with =’red20’.
- Truncate all values to 2 decimals.
- Create a business event that triggers and email when a Current Qty On Hand reaches zero and the Yield is outside of the 97-103 range. I’m testing a version of this right now and will post it if it works and others are interested.
Closing:
I hope this helps others, and I welcome any constructive criticism. This was a challenge to build, but a fun puzzle.
I’d love to hear how others use this, and if anyone has any ideas for improvement.
This is the most complex GI I’ve made. The Open University course on GI’s was immensely helpful.
Cheers,
Nathan