
Hello Experts, How can we design a dashboard were open invoiced status whose payment is left and payment status which is completed, to be show in single column chart graph
Solved
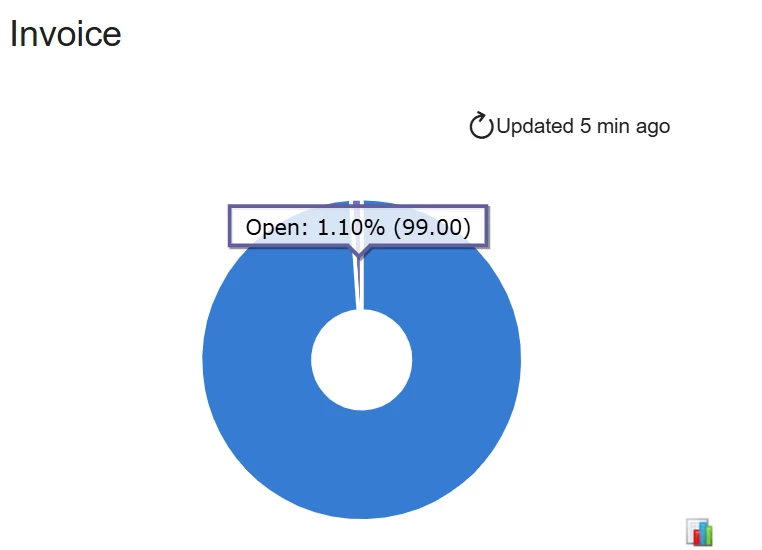
how to show open invoiced and payment completed record in dashboard in a single column chart graph
Best answer by Rakshanda
Hi
Steps to achieve above
- Create a Generic Inquiry (SM208000) using ARInvoice as the primary DAC and include the fields Status, OpenDoc, and CuryDocBal.
- Add conditions to filter only valid invoices: Released = True and Voided = False as it was required.
- In the Results Grid, add a calculated field PaymentStatus with the formula:
Open Invoices (Balance > 0)
Paid Invoices (Balance = 0)
IIf([ARInvoice.CuryDocBal] = 0, 'Paid', 'Open')
This identifies whether an invoice is paid or open.
4. Add another field InvoiceCount using RefNbr and set its Aggregate Function to Count, then group the results by PaymentStatus.
5. Save the GI and create a dashboard (SM208600). Add a Chart Widget, select the GI as the data source, choose Column Chart, set PaymentStatus and InvoiceCount.

Login to the community
No account yet? Create an account
Social Login
Login with your Acumatica accountEnter your E-mail address. We'll send you an e-mail with instructions to reset your password.