Answer

No way to view API Requests?

  • December 22, 2021
  • 3 replies
  • 459 views

jharris
Semi-Pro I
Forum|alt.badge.img+7

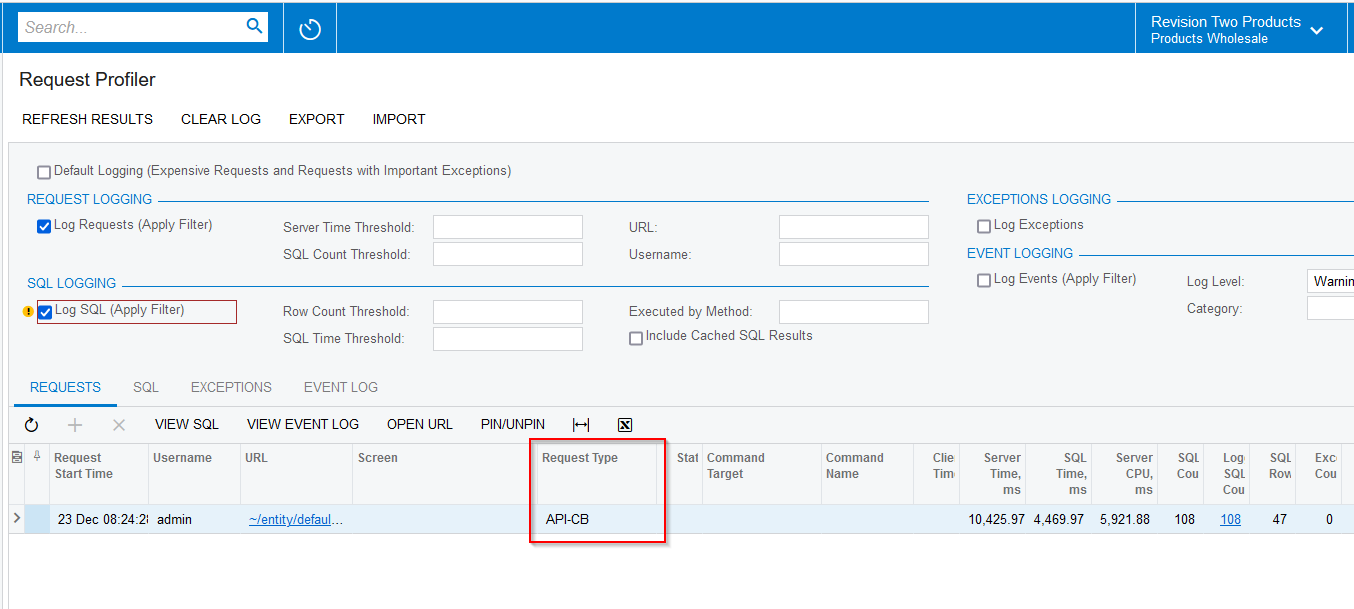
I wish there was a way to view API requests or logs from the UI…  The platform is so robust when it comes to API’s and the only thing we can see is from events to the database. This would help a lot when it comes to troubleshooting and implementation!

Best answer by Naveen Boga

Hi @jamesh  I think we can  see what are all the requests we have sent to Acumatica using Request Profiler screen (Request Type → API), but I’m not sure we can even see API request JSON data on the GI.


3 replies

Naveen Boga
Captain II
Forum|alt.badge.img+19
  • Captain II
  • Answer
  • December 23, 2021

Hi @jamesh  I think we can  see what are all the requests we have sent to Acumatica using Request Profiler screen (Request Type → API), but I’m not sure we can even see API request JSON data on the GI.


TimRodman
Pro I
Forum|alt.badge.img+1
  • Pro I
  • November 17, 2023

This is a great screen @Naveen Boga. When Request Type is filtered on API-CB, I love that I can see the URL that an outside application is calling.


Like you though, I really wish that there was something like a VIEW JSON button above the grid that you could click to see the JSON for an individual API call.


Since that would be A LOT of data, it would probably make sense to also have an Include JSON checkbox (similar to the existing Include Cached SQL Results checkbox) in the REQUEST LOGGING section so you could decide whether or not you want the Request Profiler to include the JSON results.


I would add this as an Idea, but I don’t have access to the Ideas area anymore. Tagging @vpanchenko in case he knows of anything.


drmccann
Freshman I
  • Freshman I
  • August 30, 2025

➡️There is a workaround to be able to see the actual JSON/XML requests/responses…

A few years ago, I had an issue with the Acumatica-Avalara integration.  I had no idea which API resource was being called, or the data sent/received.  So I set up what amounts to a man-in-the-middle “attack” on our own development server to capture all traffic.  Basically, on your dev instance:

  1. Spin up a proxy tool like Fiddler
  2. Generate a root certificate and install into Windows trusted root store so Acu/ASP.NET accepts it when the proxy re-signs TLS traffic.
  3. Using IIS, configure Acumatica traffic to flow through the proxy (Fiddler).
  4. Capture traffic and view full JSON/XML request/response.

This is only an option on your own dev instance - not on hosted instances.  It’s a bit of work to set up but does accomplish the goal.  Remember to tear down afterwards to avoid security vulnerabilities.

I’m currently troubleshooting a BigCommerce integration anomaly and having the ability to view the JSON of each request/response would save hours of guesswork.

⭐Adding a “Log HTTP Requests/Responses” checkbox would be a very welcome feature.