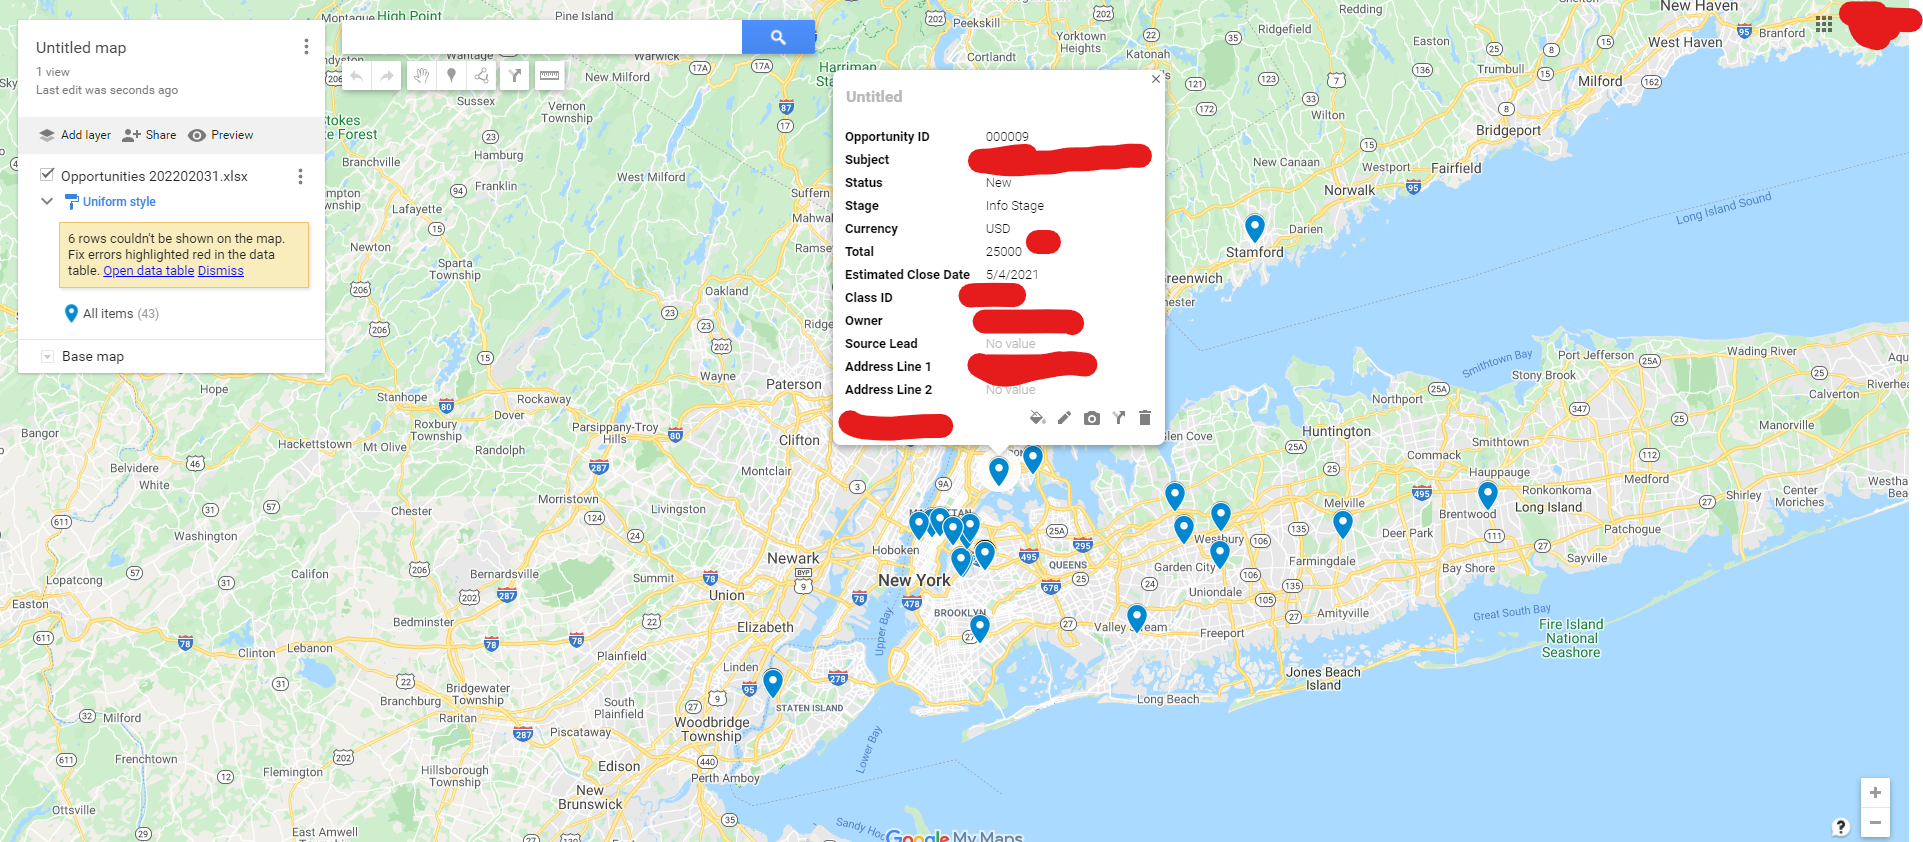
A client wishes to display on a Google map the location of each open opportunity in Acumatica. To be able to visually observe geographicclustering of opportunities. Any recommendations on how to accomplish this?
In Opportunities:
- Adjust Colum View Screen to show address field, City Zip ETC.
- Export to Excel
- Import into Google Maps.
You could probably Set up a Cron Task to export this @ specific frequency, and get a bit more fancy - but this should suffice.
I just tested this - and it works far better than I thought as straight import.
I have thought about this - there is too much heavy lifting for me to do this on my own.
IF I were to try to do an integration like this, without fully knowing breadth of acumatica - and having some limited programming knowledge myself - I would look to use a tool lIke IBM’s node red.
This would allow you to login, and perform a cron task I believe. You would be able to easily check for additions to the file, then could have the flow execute an update.(through a secondary flow) Logs in to acuamtica, and updates the data for you.
I have not used with acuamtica, but have used with other IOT integrations, AWS etc. NODE red is something that would allow you to accomplish what you may not be able to manually code for. Someone more proficient than me could probably create a sample flow that would work for most use cases, changing login info and database and or screen source.
This article below may be a starting point if you are ambitious enough (to be clear I have no affiliation with either node red or below!).
https://www.cdata.com/kb/articles/apiserver-node-red.rst
Reply
Enter your E-mail address. We'll send you an e-mail with instructions to reset your password.