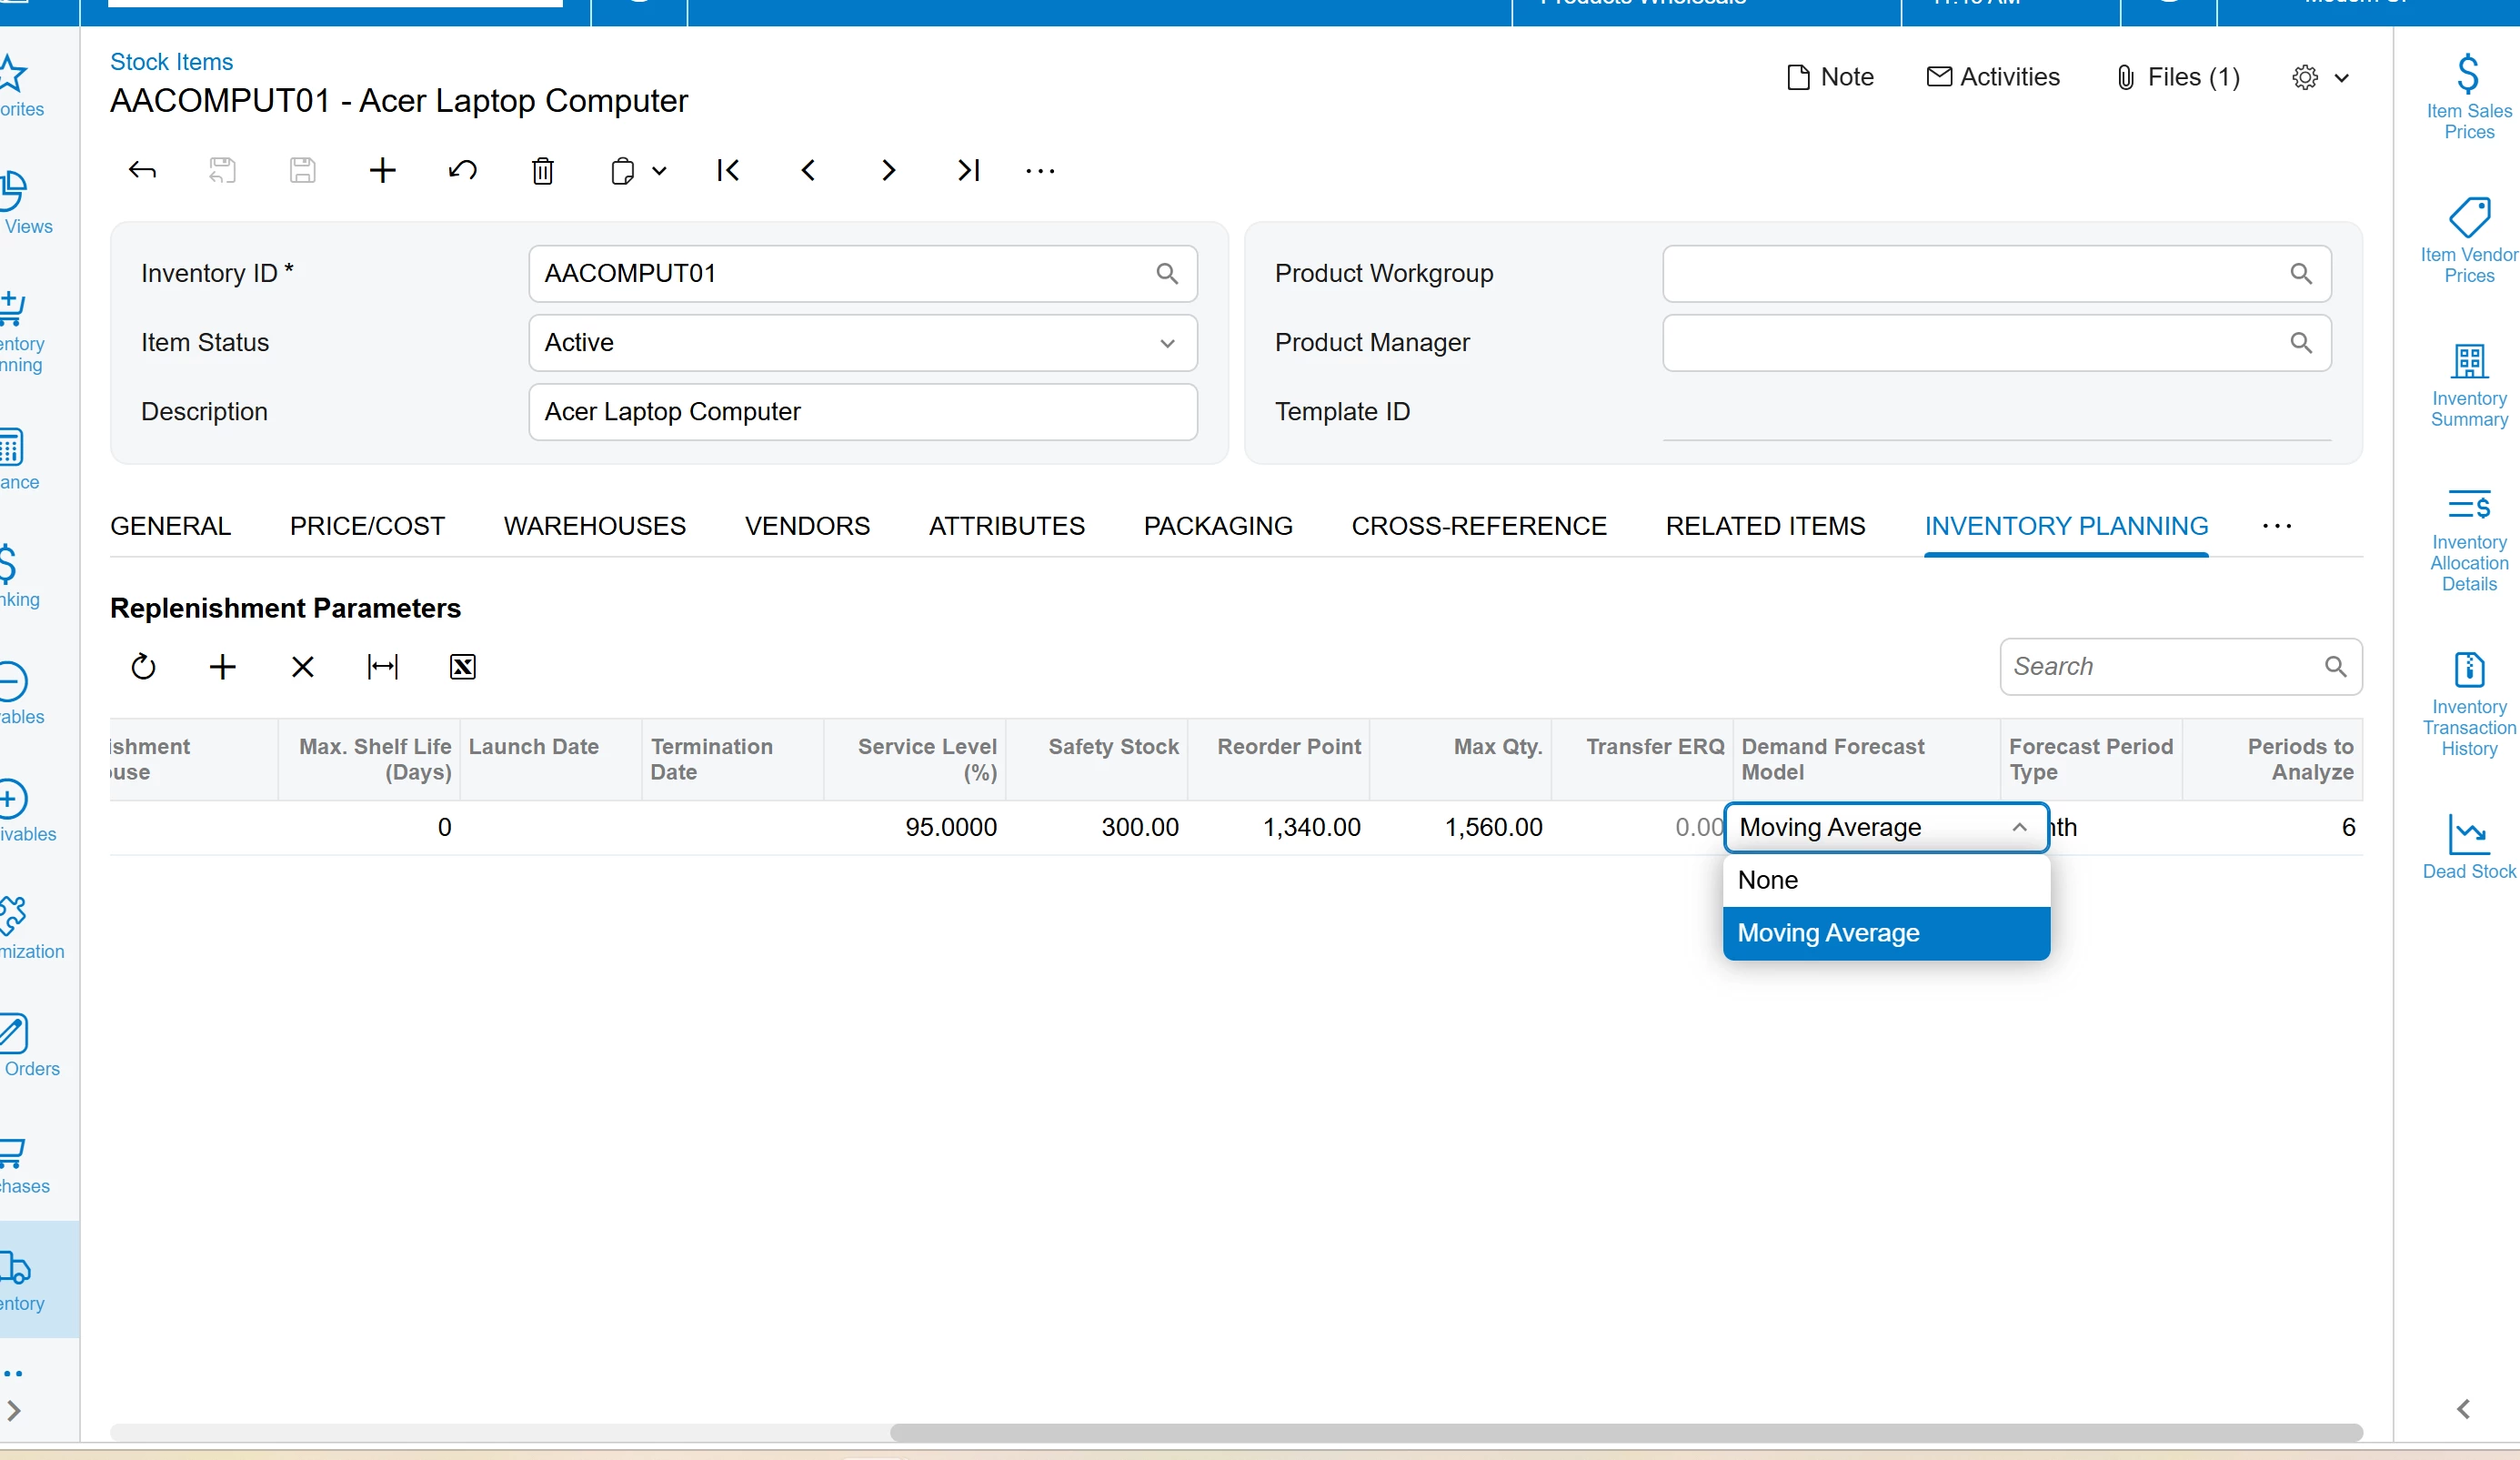
@rkenna Short version: it's not reading orders or invoices. It reads released inventory transactions, summed by day for each item and warehouse. So your history is whatever has actually been issued from stock.
To take your questions in order:
Invoice lines or SO lines? Neither. A sale counts when the inventory issue behind the shipment or invoice is released. Open orders and unreleased shipments aren't in the numbers yet.
Branches? No. It's per warehouse. Branch doesn't come into it.
Transfers? Yes, on the way out. A transfer counts as demand at the warehouse it leaves. Transfers in don't offset anything.
Returns? Yes. Credit memo quantity is subtracted from sales.
What's ignored: drop ships, and manual issues or adjustments entered directly on the IN screens.
Now the periods. They're calendar periods, so months start on the 1st. The period your Forecast Date falls in is skipped, and it looks back the number of full periods in Periods to Analyze. Each period becomes a daily rate (total divided by days, scaled by your seasonality factor). The forecast is just the average of those. A period with no sales counts as zero, as long as the item had sold before it.
Safety stock uses the variance of those daily rates and of your PO receipt lead times, times NORMSINV of the service level. Reorder point is lead time × daily demand + safety stock.
This is from the 2026 R1 code.