Solved

Acumatica Performance Issues

  • February 4, 2025
  • 1 reply
  • 295 views

Forum|alt.badge.img

Hi all, we have a pretty large ACU implementation that ends up crawling to a halt.  I am NOT the Acumatica owner in that, I do not support this system, another vendor does.  


We have written a robust integration that uses GI’s and OData to sync data to an external DB which is for the public facing eCommerce website. I use a combination of hot path and cold path data syncs. Hot paths are push notifications...so I get the data updates for some entities that way. The Cold path are syncs that run every 3 hours. This uses oData over the GI’s. These will reconcile any thing that might have been missed on the push notifications and other entities that don’t need to be as timely.  All the syncs are delta/incremental updates.  All of those queries are quite fast on a normal day.  When there are system issues, these really slow down as well. These syncs have been in play for many many months.  Almost untouched for the last 6-9 months.


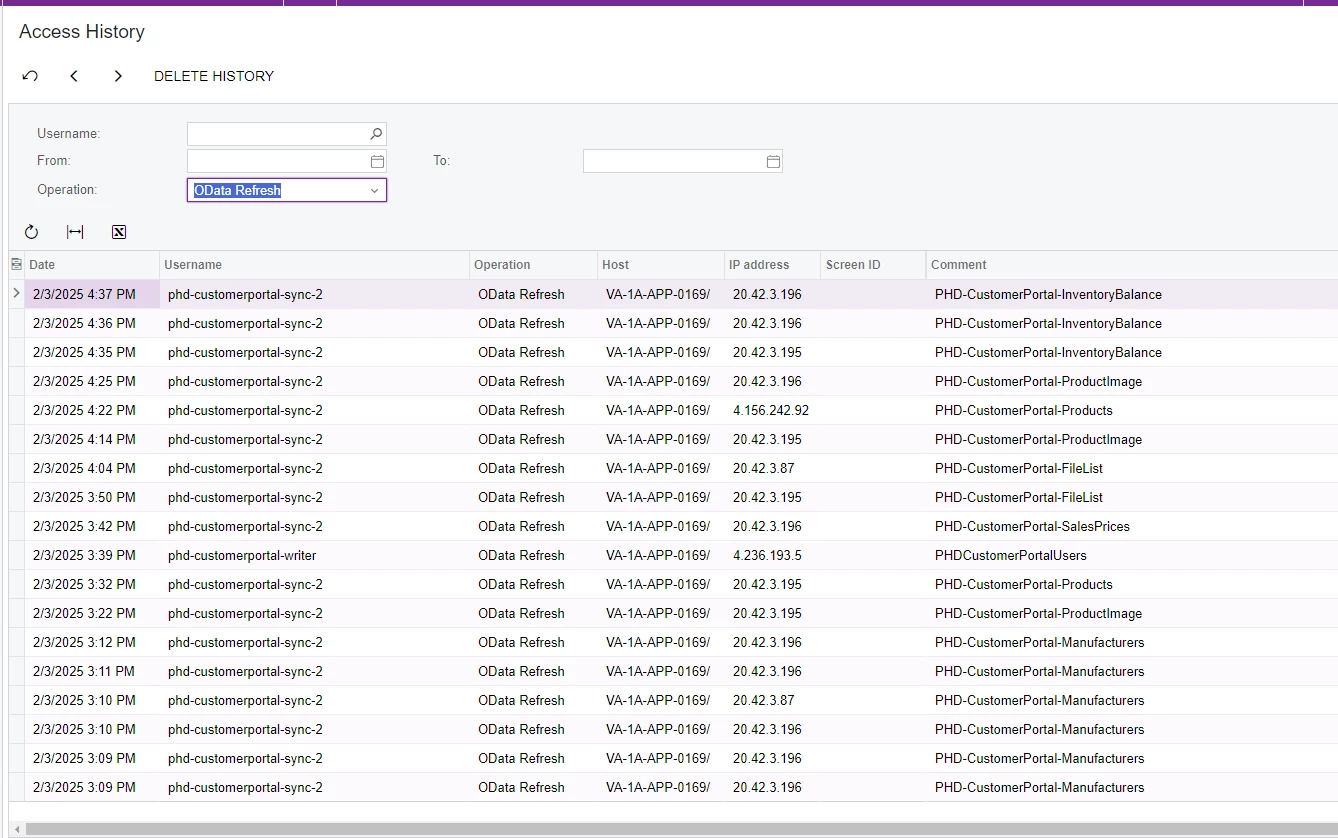
My issue is that we (for lack of better terms) are being blamed for the performance issues. The oData syncs are consuming all available platform resources. This forces the ACU to vendor to recycle the app thread. It often comes back after a short period of time.  Below is their “evidence” that prooves we are breaking things.  I read this as at most, 4 odata query calls per minute. Keep in mind, these are single row/record data pulls. I am not pulling thousands of rows and they are not large running queries.


How can I go about digging into troubleshooting this? I would like to find the culprit of what is consuming the most resources.  Any pointers on what I can use to help narrow this down before we start tearing down all of our syncs .


Here is version info:

Acumatica Cloud ERP 2024 R1
Build 24.111.0011 +


Thank you all!!


Best answer by wkappauf

The server resource is only designed to operate to the allowable resources of your Acumatica license.  When you have a heavy integration that is slowing down user performance the options are almost always the same and you should evaluate:

  1. Evaluate the System Monitor and Request Profiler to better understand the affect each of those transactions is having on the server.  The access history will tell you when things occurred but not what they actually did or how much time they took to complete.
  2. Review the cadences of the automation schedules and adjust as needed.
  3. Evaluate the export/imports are not over-sharing.  For example, if the inventory balanace is sending a full inventory qty update vs updating 1 item that is a big difference on the resource consumption.
  4. Evaluate for redundancy.  The screenshot shows the Manufacturers refresh ran 6 times in 4 minutes.  It’s hard to know what it is doing based on the information provided, but does stand out.

When you have determined that the cadence and data in each request is appropriate for the business need and the server resource drain continues to be too high, then you should contact your partner about acquiring a process node.  The process node comes with a cost, but it allows you to basically have a 2nd Acumatica website where you can run all of your integrations and Automations through.  That frees up all of the server resource on the User Website when you complete the testing and eventually elevate all of the automations to run from the Process Node. 

Good luck!

Will  

1 reply

  • Freshman II
  • Answer
  • May 22, 2025

The server resource is only designed to operate to the allowable resources of your Acumatica license.  When you have a heavy integration that is slowing down user performance the options are almost always the same and you should evaluate:

  1. Evaluate the System Monitor and Request Profiler to better understand the affect each of those transactions is having on the server.  The access history will tell you when things occurred but not what they actually did or how much time they took to complete.
  2. Review the cadences of the automation schedules and adjust as needed.
  3. Evaluate the export/imports are not over-sharing.  For example, if the inventory balanace is sending a full inventory qty update vs updating 1 item that is a big difference on the resource consumption.
  4. Evaluate for redundancy.  The screenshot shows the Manufacturers refresh ran 6 times in 4 minutes.  It’s hard to know what it is doing based on the information provided, but does stand out.

When you have determined that the cadence and data in each request is appropriate for the business need and the server resource drain continues to be too high, then you should contact your partner about acquiring a process node.  The process node comes with a cost, but it allows you to basically have a 2nd Acumatica website where you can run all of your integrations and Automations through.  That frees up all of the server resource on the User Website when you complete the testing and eventually elevate all of the automations to run from the Process Node. 

Good luck!

Will