I’m wondering if anyone at Acumatica ( especially @vpanchenko ) has some insight on this.

I’ve noticed this behavior before, but this is the first time that I got out my stopwatch to time it and verify.

I’m on an Acumatica site, pulling data from a Generic Inquiry over Acumatica OData, using Power BI Desktop. The Generic Inquiry is a Generic Inquiry of AR Invoice Lines, pulling from PX.Objects.AR.ARTran and PX.Objects.AR.ARInvoice. The build is 21.209.0034.


I tried two different methods of accessing the data:


First Method
Connect to the Acumatica OData URL, then browse to the Generic Inquiry within the Power BI user interface, then remove all columns except DocType, RefNbr, and LineNbr using the Power BI user interface. The end result is three columns and this is the Power BI code that gets generated.

let
Source = OData.Feed("https://mycompany.acumatica.com/odata/production", null, oImplementation="2.0"]),
#"PBI-ARInvoiceLines_table" = Source{"Name="PBI-ARInvoiceLines",Signature="table"]}eData],
#"Removed Columns" = Table.RemoveColumns(#"PBI-ARInvoiceLines_table",{"CustomerID", "DocDate", "Item", "NetSalesAmt", "TranType", "ReferenceNbr", "ClassID", "InventoryID"})
in
#"Removed Columns"


Second Method
Connect to the Acumatica OData URL, but specify the columns that I want using the $select parameter within the OData URL. The end result is the same as the First Method, but I can accomplish it using one step in Power BI and here is the Power BI code that gets generated:

let
    Source = OData.Feed("https://mycompany.acumatica.com/odata/production/PBI-ARInvoiceLines?$select=DocType,RefNbr,LineNbr", null, nImplementation="2.0"])
in
    Source


In the First Method, Acumatica sends more than 3 columns of data over to Power BI, then Power BI removes the columns once they arrive. So, I would think that the Second Method would run faster because Acumatica is only sending 3 columns of data over to Power BI.

But, the Second Method takes longer to refresh in Power BI than the First Method.

The First Method takes about 30 seconds to refresh.

The Second Method takes about 45 seconds to refresh.

FYI, there are about 36,000 records in this Generic Inquiry.


3 questions:

1. Is this kind of behavior expected?

2. Could it be that Acumatica has to do more work when you put $select in the OData URL and that’s why it takes longer?

3. Could the speed of $select be addressed when moving to OData V4 as discussed in this post?


I was chatting with @hazen35 on my Acumatica Podcast and this happened to come up after we stopped recording. So, we exchanged some emails and he helped me out.


The First Method takes about 30 seconds to refresh.

The Second Method takes about 45 seconds to refresh.

The Hazen Method takes about 20 seconds to refresh!


The Hazen Method is a little more involved, but not too bad.


First, paste this into the Power BI Desktop query window:

let
Source =
Json.Document(
Web.Contents(
"https://mycompany.acumatica.com/odata/production/PBI-ARInvoiceLines",
)
),
value = Source value],
#"Converted to Table" = Table.FromList(value, Splitter.SplitByNothing(), null, null, ExtraValues.Error)
in
#"Converted to Table"


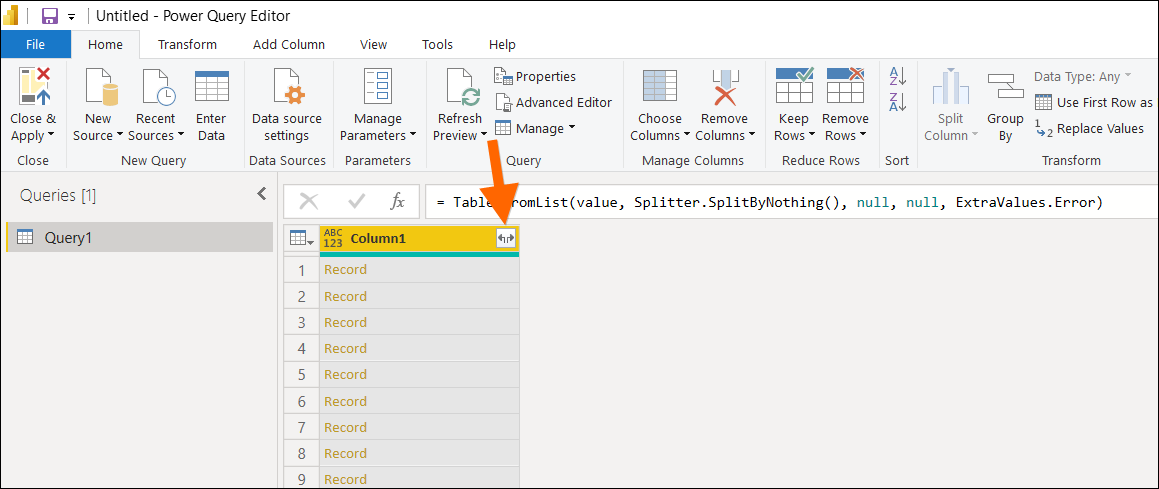
Then, click this icon to expand the records into columns.


After that, you can set the names and data types for each column.

So, it’s a little more work, but it allows me to use both the $select and $filter parameters on the OData URL in a way that’s efficient.

Thanks Hazen!


This is actually really good. I can confirm 50% reduction in performance for my test query. OData seems to be very bandwidth intensive as I can see MBs of data downloading with OData, but with JSON it doesn’t even show. 

One thing, Dates need to be modified before attempting to convert to Date type due to JSON datetime format - I just stripped out T00:00:00 from the string and then it converted fine.


Hey @RoyceLithgo!
Glad this works so well! 50% reduction in performance? Do you mean 50% reduction in time / 50% increase in performance? 

As for converting date type, you mean on the $select filter, yes? 
So I have two ways that I do this. I’m I’m entering a static date, I just make sure to use "yyyy-MM-ddTHH🇲🇲ss" format. But if I want to use a relative date, I’ll use this template: 
DateTime.ToText(Date.AddDays(DateTime.LocalNow(),-9),"yyyy-MM-ddTHH🇲🇲ss")

Replace “-9” with number of days from today you want the relative filter. 
But yeah, you need to make sure to use that format. Took me a lot of trial and error to get that to work, as well!


I’m glad that the Date thing came up. I encountered the same thing after posting this. My workaround in Power Query was simply to change the data type to Text. Then do a second step to change the data type to Date. Just make sure you don’t replace the first step when doing the second step.


Hey @hazen35! Sorry yeah I meant 50% reduction in time taken to refresh. 

For the date, I tried Convert type originally and it gave an error. After removing the timestamp it worked. I didn’t think to try doing something in $select. Might give that a go. 


Thanks for the shoutout @TimRodman ! I also believe that the differences in timing get exponentially or at least progressively worse the bigger the dataset as well. I remember trying the odata.feed with parameters on a generic inquiry with over a hundred thousand rows, and probably 10ish columns and walking away from the machine and having to eventually force quit the refresh. 
The web.contents vastly expands the limitations of the OData feed via Power Query not just because of the ability to select parameters and have the feed filtered on the database side, but also it just seems like the same exact refresh is faster with this method. I haven’t done extensive testing, but would be interesting to understand the differences and limitations. 


@tim I’m sorry for the late response since typically we investigate such cases as support cases.

I measured querying the same Generic Inquiries with and without $select option on 2022R2, and the query with the $select options works almost x2 faster, not slower. I used Developer Tools in Chrome to measure the time. My suspicion is that the slowness is attributed to the client, that’s why The Hazen Method helps.


That would make sense to me. Speaking of the client side of things (good timing), I just tried the refresh using a Dataflow in Power BI and it appears to refresh faster for some reason. I haven’t tried doing any benchmarking yet though.


Reply