Solved

Dashboard Tile Displays Incorrect Counts

  • 30 January 2024
  • 5 replies
  • 72 views

Forum|alt.badge.img

We have a dashboard tile that displays list of PO Lines based on the user logged in (we have a parameter for this). 


Currently this tile shows 7 items, but when you click on it, it only displays 4 (on the drill down)


Below are the filters applied on the tile:


And here are the widget settings: 
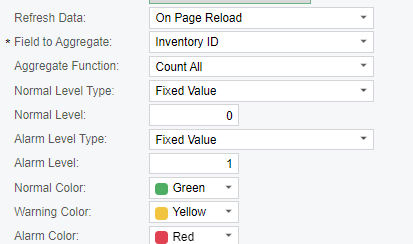
 

Can you please advise what I am missing here and how to fix it, so it shows the right count? 

Best answer by hkabiri

@kanupindi  in 2023R2 version you can open Dashboards (ScreenId=SM208600) and select which Widget to be active and this way you can keep the one you want to track and deactivate others.

Once you load the Dashboard now you can see the Query for that widget under Trace > Request -->SQL

Here is an example from my local instance:


View original
Did this topic help you find an answer to your question?

5 replies

hkabiri
Acumatica Moderator
Forum|alt.badge.img+7
  • Acumatica Support Team
  • 191 replies
  • January 31, 2024

@kanupindi in some cases those checkbox or virtual fields are not actually work on Dashboard. You need to check the Trace on Dashboard to find out the query for that specific widget.


Forum|alt.badge.img
  • Author
  • Jr Varsity III
  • 63 replies
  • January 31, 2024

Hi @hkabiri , thank you for the feedback. I know the trace works on a page level. Could you please advise how can I check the trace for a widget/ see the query being used?


hkabiri
Acumatica Moderator
Forum|alt.badge.img+7
  • Acumatica Support Team
  • 191 replies
  • Answer
  • January 31, 2024

@kanupindi  in 2023R2 version you can open Dashboards (ScreenId=SM208600) and select which Widget to be active and this way you can keep the one you want to track and deactivate others.

Once you load the Dashboard now you can see the Query for that widget under Trace > Request -->SQL

Here is an example from my local instance:


Forum|alt.badge.img
  • Author
  • Jr Varsity III
  • 63 replies
  • January 31, 2024

hi @hkabiri, we are currently using 2022 R2, is there a different way to troubleshoot this dashboard tile issue? thank you. 


BenjaminCrisman
Acumatica Employee
Forum|alt.badge.img+4
  • Acumatica Support Team
  • 621 replies
  • February 2, 2024

 @kanupindi It could be that the parameters aren’t getting passed correctly. When you drill into the widget can you check the filter to see if the names of the filter lines match exactly as they are seen in the widget?

I recently came across an issue which looks very similar to what you’re reporting and it had to do with the filter using @me variable. Inside PXView.prepareFilters(), it was converted into "admin".
Then, in GI, it is processed once again, and here the filter is voided because data types does not match (String).

But this could be seen in the filter on the dashboard showing a different name for the same filter condition that the GI shows.


Reply


Cookie policy

We use cookies to enhance and personalize your experience. If you accept you agree to our full cookie policy. Learn more about our cookies.

 
Cookie settings