Solved

Changing the color of Grid field based on value

  • December 4, 2024
  • 2 replies
  • 59 views

Forum|alt.badge.img

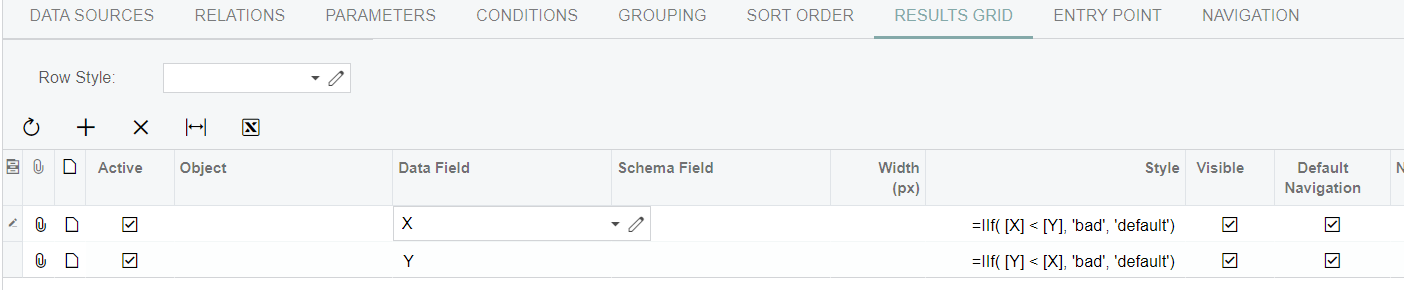
There are two columns, namely X and Y, in a grid. I need the following functionality:
 

When the value in X is lower than the value in Y, the X field color should change to red. and

When the value in Y is lower than the value in X, the Y field color should change to red.

Example:

For example, if X = 3 and Y = 6, the X field should appear in red.

For example, if X = 8 and Y = 5, the Y field should appear in red.


How to achieve this, I need steps on how and code if possible.

Note: I do not want to highlight the entire row, only the specific field.

Best answer by jzhu

In the Style column of your Result Grid, you can try using the IIF statement. In the same row of your X data field and Y data field, try =IIf( [X] < [Y], 'bad', 'default') or =IIf( [Y] < [X], 'bad', 'default')


View original
Did this topic help you find an answer to your question?

2 replies

Forum|alt.badge.img
  • Semi-Pro II
  • 122 replies
  • Answer
  • December 4, 2024

In the Style column of your Result Grid, you can try using the IIF statement. In the same row of your X data field and Y data field, try =IIf( [X] < [Y], 'bad', 'default') or =IIf( [Y] < [X], 'bad', 'default')


darylbowman
Captain II
Forum|alt.badge.img+13

Check out this StackOverflow answer


Reply


Cookie policy

We use cookies to enhance and personalize your experience. If you accept you agree to our full cookie policy. Learn more about our cookies.

 
Cookie settings