
Hi
I would like make some Profit and Loss report (DPL) figure in Dashboard for easy reference. example: revenue , gross profit , net profit.
Not sure who can share with me how to extract the figure to dashboard?
Hi
I would like make some Profit and Loss report (DPL) figure in Dashboard for easy reference. example: revenue , gross profit , net profit.
Not sure who can share with me how to extract the figure to dashboard?
Best answer by msw21
Seems like the only way would be to create a generic inquiry that uses formulas that equate to the result you are looking for and base the dashboard off of that.
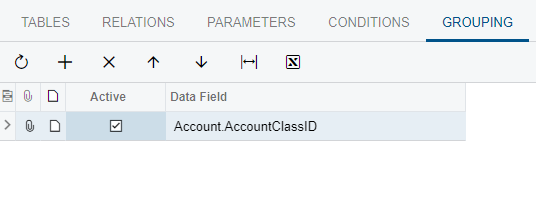
Roll up the accounts by account classes in the inquiry and then use formulas based summary or off the calculated columns.
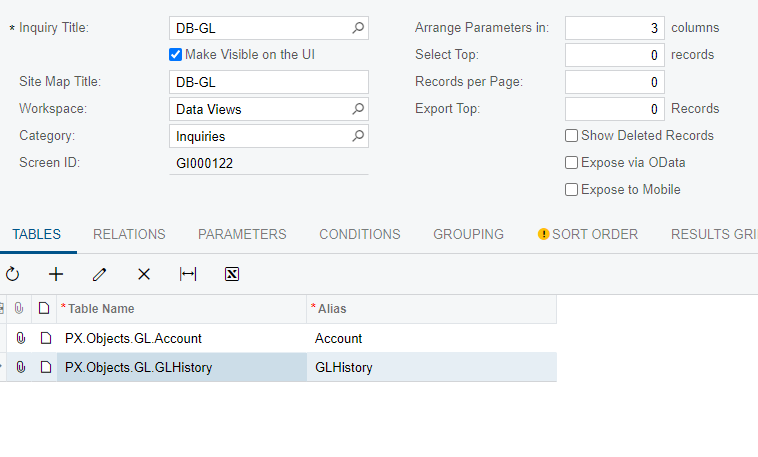
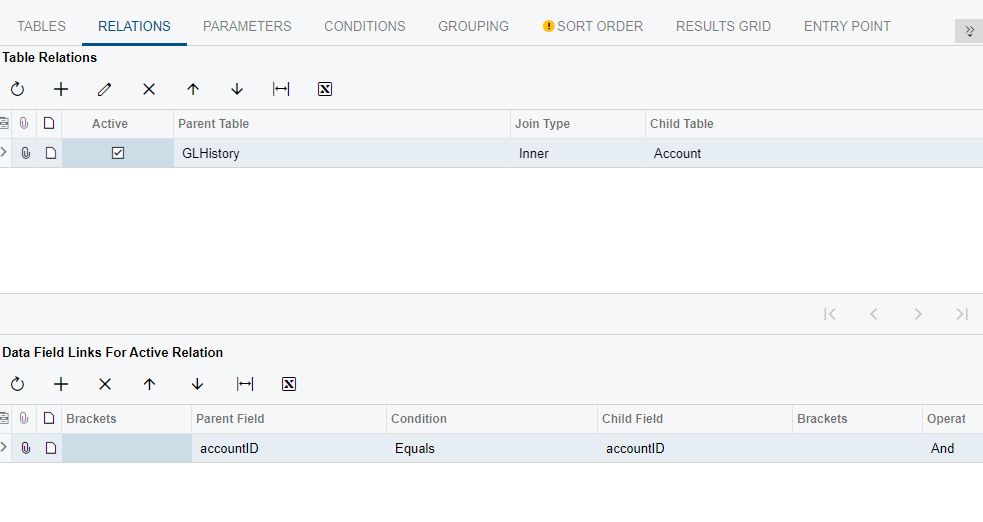
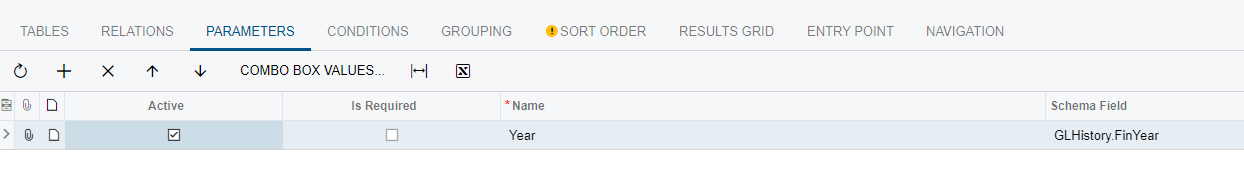
I was able to do something basic by using these two tables. I added a Year Parameter and that gave me current ytd totals.
Hope this helps a little. Maybe someone has a quicker way as I am not completely versed in all the
tables and fields.
Screen shots below.
Michael
Michael
No account yet? Create an account
Enter your E-mail address. We'll send you an e-mail with instructions to reset your password.
