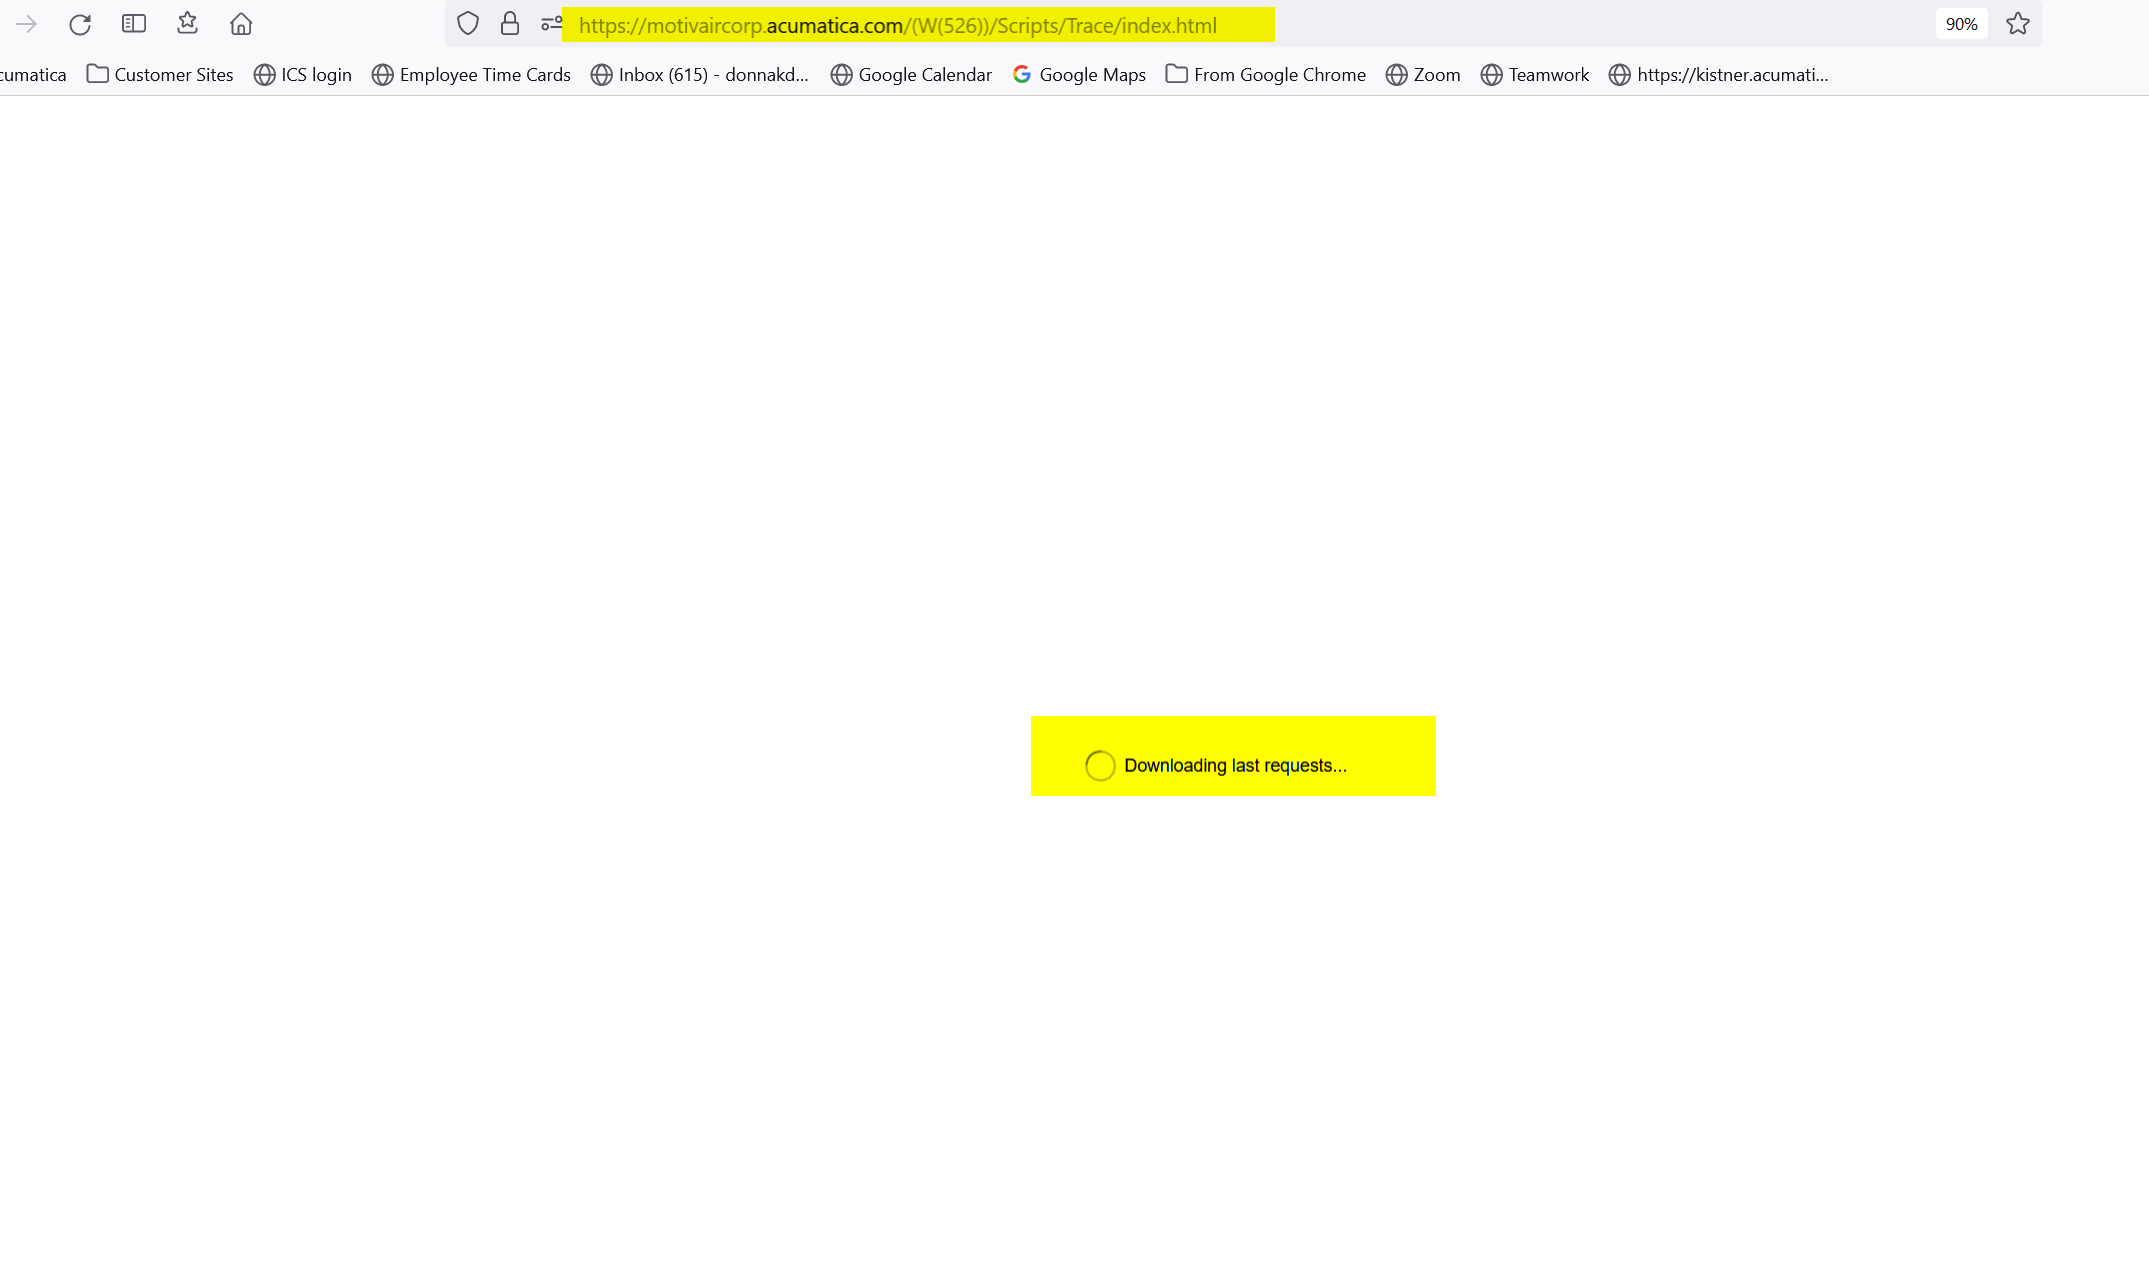
The issue you’re describing with the “circle of death” (loading spinner that never completes) when trying to open the Trace screen or reviewing errors in Acumatica seems to be affecting multiple customers across various screens. Since it started happening around the same time for several users, this points to a broader issue rather than a customer-specific one.
Here are some potential causes and troubleshooting steps:
1. Recent Acumatica Update or Patch
- Cause: Acumatica frequently releases updates, patches, and hotfixes, and it's possible that a recent update introduced a bug or performance degradation affecting the Trace screen and other areas of the application.
- Solution: Check if the issue started after a recent update. Review the release notes and known issues from the Acumatica portal or your Acumatica partner. If a bug is identified, you might need to apply a fix or rollback to a stable version.
2. Performance Issues
- Cause: The Trace screen can be resource-intensive, especially if there are a large number of logs or errors to display. A sudden increase in trace data, possibly due to a misconfiguration or error loops, could cause performance degradation.
- Solution:
- Try clearing or archiving older trace logs if you suspect an overload.
- Review Acumatica's performance logs to see if there's a pattern of slow queries or high resource usage when opening the Trace screen.
- Increase server resources (e.g., memory or CPU) temporarily to see if it resolves the issue.
3. Customizations or Extensions
- Cause: Custom code, third-party integrations, or extensions that interact with system logs or trace data might introduce delays or conflicts, especially if they’re outdated or not fully compatible with the latest version of Acumatica.
- Solution: Disable any recent customizations or third-party extensions and see if that resolves the issue. If the problem goes away, then one of those customizations is likely causing the slowdown.
4. Browser-Related Issues
- Cause: If this issue only occurs in the browser, it could be related to cached data or compatibility with certain browser versions.
- Solution:
- Clear your browser cache and cookies.
- Test the Trace screen in a different browser (e.g., Chrome, Firefox, Edge) to rule out browser-specific issues.
- Ensure your browser is up to date, and that it's compatible with the version of Acumatica you're using.
5. Database Bloat or Corruption
- Cause: If the trace logs or other database tables have grown excessively large, it might cause delays when querying or rendering data. Alternatively, there could be an underlying database corruption issue.
- Solution:
- Run database maintenance tasks, such as indexing and cleaning up old logs.
- Review database size and performance metrics, particularly related to tables involved in logging and trace data.
- If corruption is suspected, consider restoring from a backup or running diagnostics.
6. Network Latency
- Cause: Network connectivity issues or latency between your client’s systems and the Acumatica server could result in long load times, which would manifest as the "circle of death."
- Solution:
- Run network diagnostics, including ping and traceroute, to check for latency or packet loss between client devices and the Acumatica server.
- If Acumatica is hosted on a cloud provider, check for any issues with the hosting provider.
7. Acumatica Cloud Environment Issues
- Cause: If you are running Acumatica in a cloud environment (e.g., Acumatica Cloud, AWS, Azure), there might be issues with the environment itself, such as server overload or cloud infrastructure issues.
- Solution: Contact Acumatica support or your cloud hosting provider to check if there are any ongoing performance issues in their environment.
Next Steps:
-
Check Acumatica Support Portal: If this issue is widespread, there might be official communication or a known issue listed in the Acumatica support portal. Search for recent issues with the Trace screen or performance bugs.
-
Open a Support Ticket: If the problem persists, consider opening a ticket with Acumatica support, especially since you mentioned it’s affecting multiple customers.
-
Workaround: If accessing the Trace screen is critical, and you’re blocked by the loading issue, consider temporarily using the Event History screen (SM201025), which also logs system-level information, as a workaround until the issue is resolved.
By reviewing these possible causes and solutions, you should be able to narrow down what's triggering the "circle of death" and address it accordingly. If this issue is system-wide across multiple clients, coordinating with Acumatica or your hosting provider will likely be the most effective approach.
😀🤗


