Hi there,

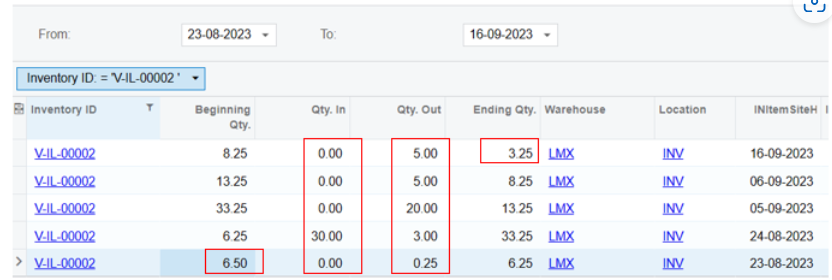
I have created a GI to know the qty beg, qty in/out and ending qty during a date range. I only use one table INItemSiteHistDay


  • Before I group by InventoryID and SiteID: 
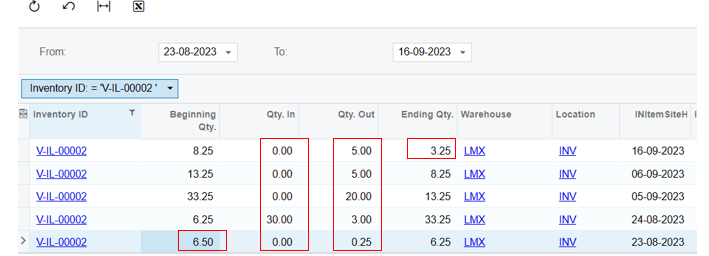
I expect to only show one line as below, but when I group by inventory ID and siteID, then I select the max Date, but Qty Beg and Ending are sum up, the Qty In or Out is correct. I do not know how to take two values from 2 rows: qty beginning of date from and ending qty of date to.

  • After grouping 

My parameter:

If you have any idea, pls advise me how to achieve it.

Thanks, in advanced.

Hi @hthuy24 ,

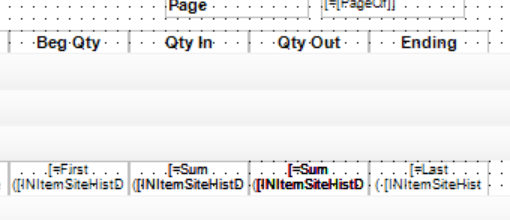
There is probably a way to accomplish this using self joins to find the earliest and latest dates, but it’s not easy :)  Much easier would to do this in a report.  There you could group on the InventoryID and the SiteID, sort within the groups by date, and use variables and/or the group headers or footers to get the beginning and ending quantities.

Hope this helps!

Laura


Hi @hthuy24 

I have added the conditions and Paramters with Tables data.

Please review and have a try.

Thanks


Hi @hthuy24 

I have added the conditions and Paramters with Tables data.

Please review and have a try.

Thanks


Thanks, @manikantad18, but the parameter and conditions you gave me that you add default parameters WeekStart and WeekEnd,
My issue is I need to learn how to take the beginning and ending quantity from the earliest and latest, but after grouping, they are summed up.. Do you have any idea how to solve this?

My expectation: 


Hi @hthuy24 ,

There is probably a way to accomplish this using self joins to find the earliest and latest dates, but it’s not easy :)  Much easier would to do this in a report.  There you could group on the InventoryID and the SiteID, sort within the groups by date, and use variables and/or the group headers or footers to get the beginning and ending quantities.

Hope this helps!

Laura

Yes, I know it isn’t very easy. Do you know any existing report in Acumatica that has the same approach to follow?  


Hi @lauraj46 , I have created a report that shows the inventory balance in a date range. One more issue is it only shows the inventory which have transactions. So I want to get the latest transaction if inventory ID does not have transactions during this. Do you have any idea how can I achieve this?

Currently I am using First and Last function, and filter the transaction within the date range


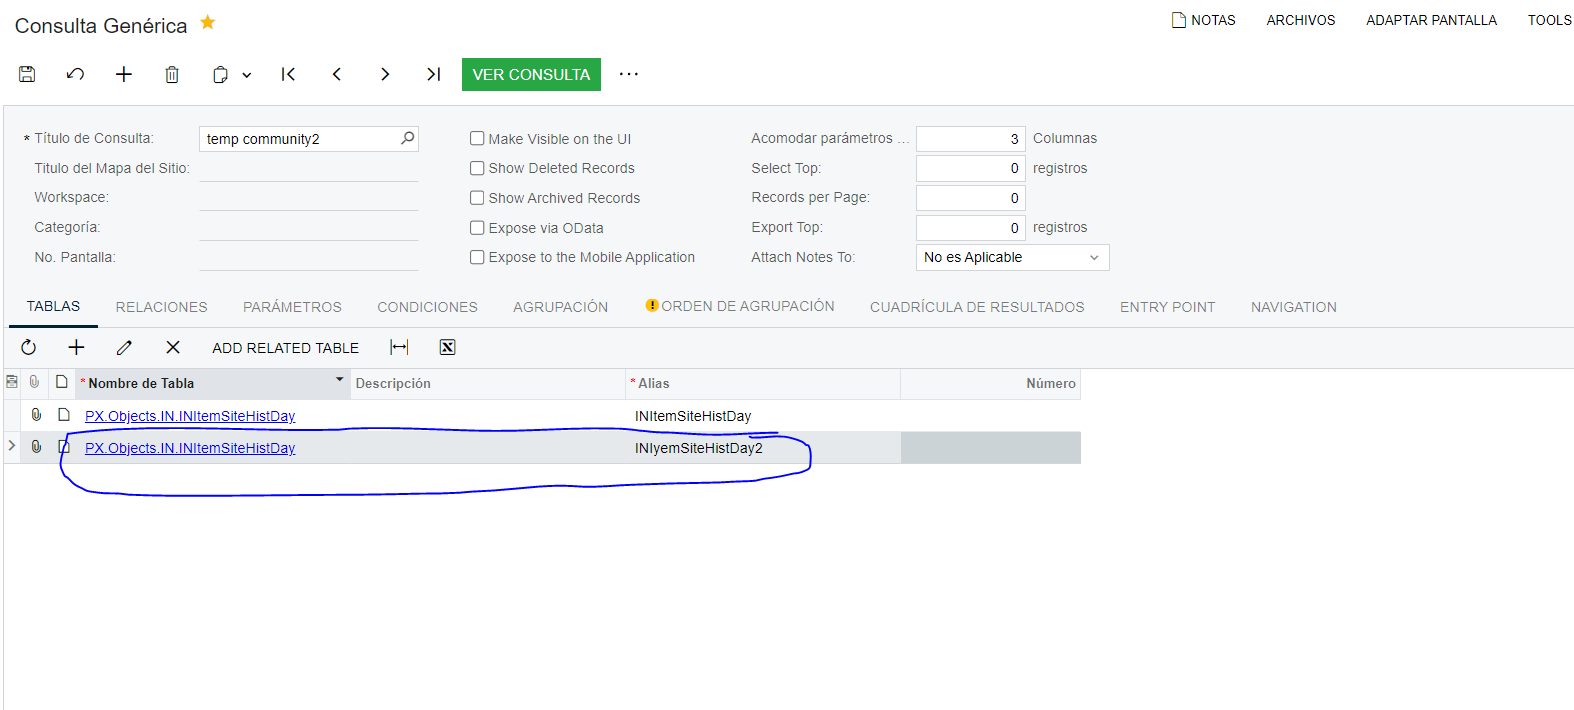
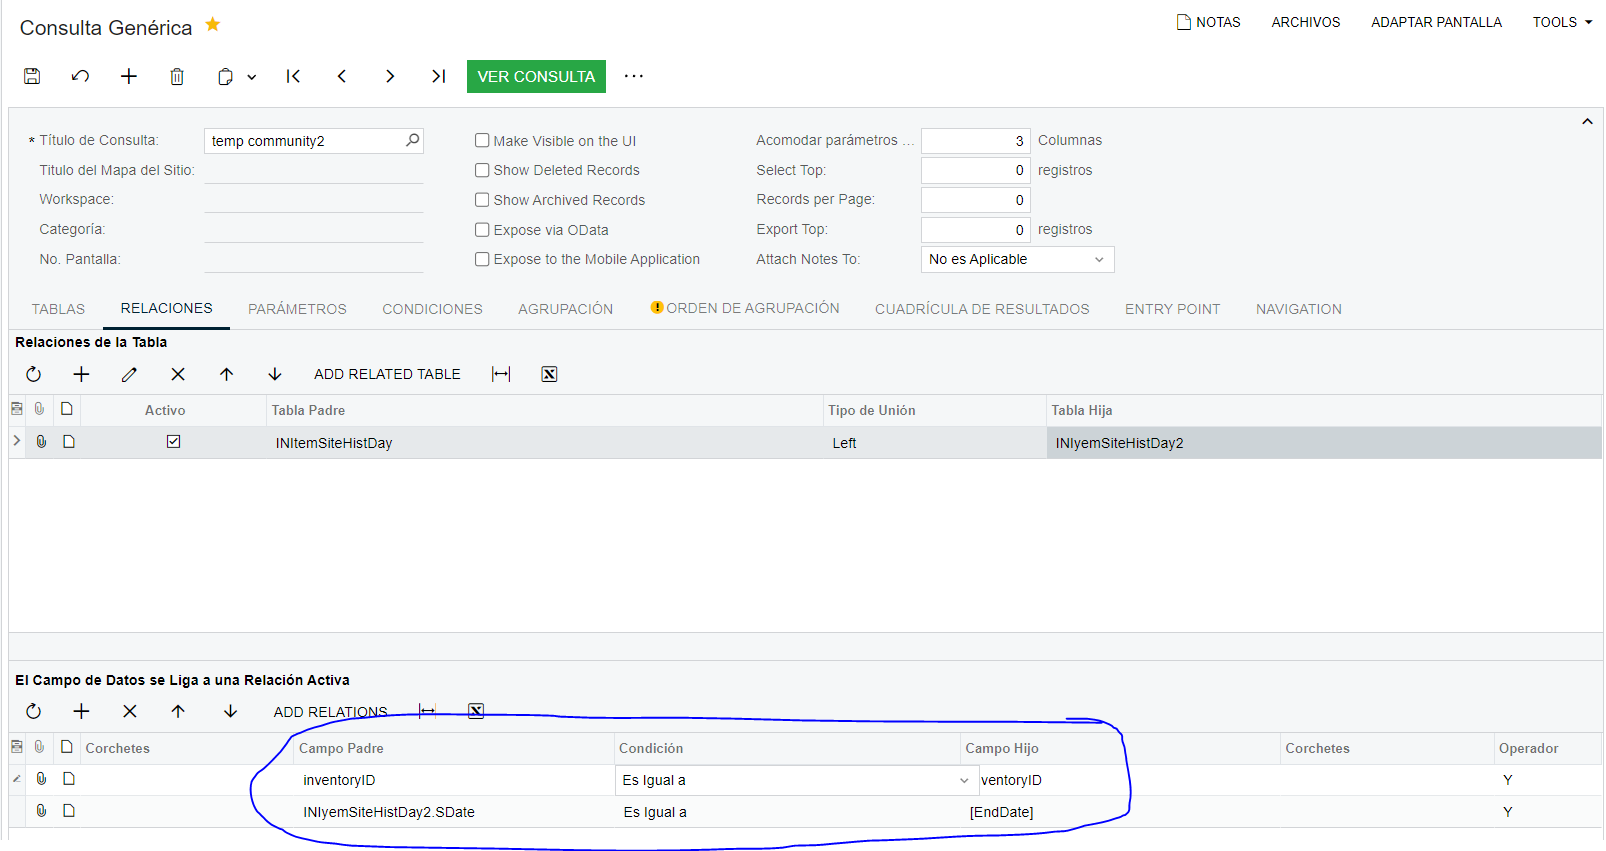
Have you tried joining the table to itself again, but with the condition that the date is equal to your EndDate? If you still want it solved with a GI this should work. It may also help you with the report designer.

 If you add the End Qty of the second table to your grid it should be 3.5 for all lines. Then, when you group you use MAX and the 3.5 will be there…

I’m not sure about the SDate field (I don’t have a distribution instance on hand to double check) but that’s the idea.


Hope that helps!


Also,

For the Report Designer you can create a couple of variables: $Date and $EndQty. The one in the date will always store the larger date that it finds so far:

=Assign(‘$Date’, IIF(INItemSiteHistDate.SDate > $Date,INItemSiteHistDate.SDate, $Date)

As the report goes through all the records it will always compare the stored date to the INItemSiteHistDate.SDate. At the end your $Date variable will contain the larger date. Then you can do the same with the Qty:

=Assign(‘$EndQty’, IIF(INItemSiteHistDate.SDate > $Date,INItemSiteHistDate.EndQty, $EndQty)

you can reset the variables for every group so you star at zero each time.

Does this make sense to you?


I'm sorry. I missed the most recent issue.

I think you could achieve this by not filtering the records according to your Date parameters.

You make the details section invisible and you only use the group footer to show the grouped data of all the inventory items.

The in/out control you manage it with variables in such a way that you only add to the variable IF the date of the movement is inside your date parameters. This way all the Inventory Items without movements will have "0" on the in/out fields and they will have starting and ending balances, but the ones that had movement will have all the correct information.

If I understand you problem correctly, which is a 50/50 proposition, this should work.

Thanks @miguel80, You understand my purpose here. That is, know the qty of inventory during the date range; if you don't have any record during that, take the latest ending qty.
But I am not clear about your idea. Not filter the records during the date range?


Yes, you will end up with 1 single line in the report for every InventoryItem but you will only have values in the "in" and "out" variables for those that did have movement in the selected dates. And instead of printing the fields you will print the variables.


Yes, you will end up with 1 single line in the report for every InventoryItem but you will only have values in the "in" and "out" variables for those that did have movement in the selected dates. And instead of printing the fields you will print the variables.

@miguel80  Can you more detail  how to get the ending qty for those inventories without movement during the date range, 
I’m sorry, but I still have no idea how to get it


If you want to use aggregates in a formula, you can aggregate the individual field in a row above the formula, then use the aggregations in the formula.  

This can help if you are using two fields (In and out) to figure out your qty but need to filter and group it first.  


Hello All,

I found this post very interesting and helpful. I appreciate the answers and the forum to find solutions.

My case is similar but….Instead of a date range I actually need an “AS OF” date for Inventory balances with last in cost. I believe I can get the second part done if I get the AS OF out of the way.

Can anyone give me some hints on how to come up with a GI to display AS OF information? If you want to add the 2nd part about the cost, I will not be upset! :-)

Thank you very much.

Claudio


Do you want the last cost of an item, but date that cost was calculated could really be any date prior to your as of date, correct?  

So if you want a Cost as of 12/23/2023, but there have been no transactions since 1/13/2023, you want that cost?

Try this:
Add the table you are using a second time, INTranCost for example to create a self join. Call it INTrancostmax for example. 

Join those with Inventory ID and Site.  

Filter InvMult to 1 for both tables so it only returns costs for receiving/producing the item.  Maybe filter to document types for better results. 

Group by Trandate and Trancost only on the INTrancostmax table.  Also group by Inventory ID and SiteID.  

Add Max of TranDate to the results from the INTranCost table.  
=iif(INTrancostmax.TranDate] = Max(nINTranCost.TranDate]), .INTrancostmax.TranCost] /xINTrancostmax.Qty],0)

Run the GI and filter the result to <> 0.  That will be your most recent cost.  

Now add a parameter for your as off date and add that to your conditions to get an as of date.  


Hi Bryan!

Thank you very much, hoping you had a great Xmas.

Let me try it and let you know.

Thanks again,

Claudio


Reply