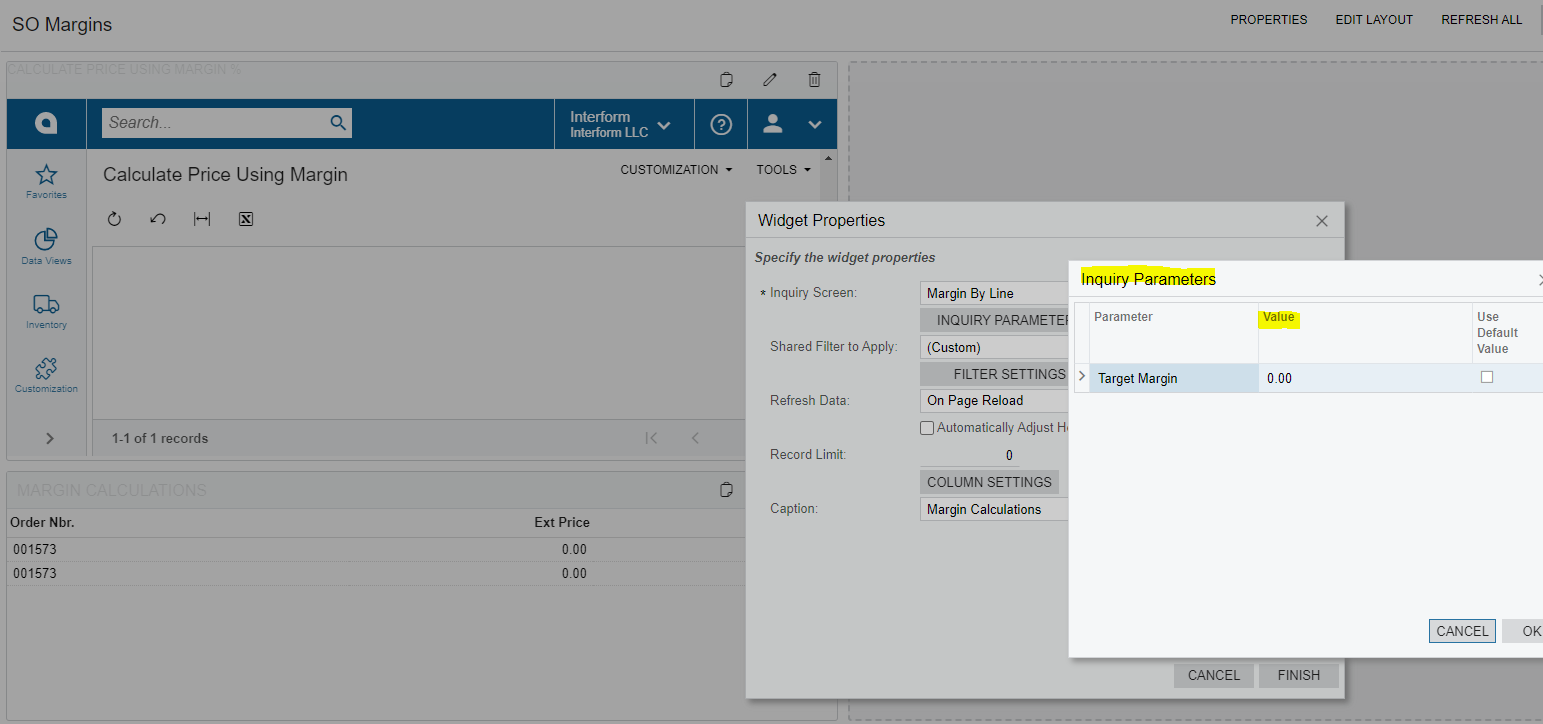
I have GIs that are designed to dynamically include a sales order total to either a MTD column or YTD column depending on the value of the date in the GI’s parameter. We are using grouping and aggregates to summarize these totals by Branch and Month or Branch and Year.
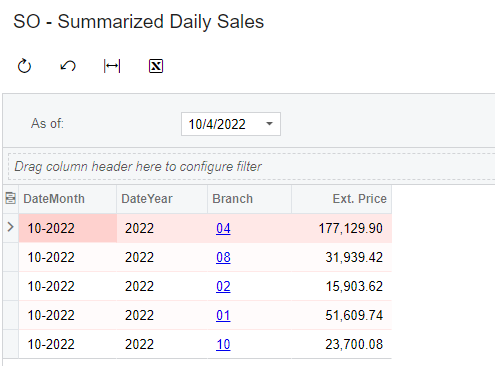
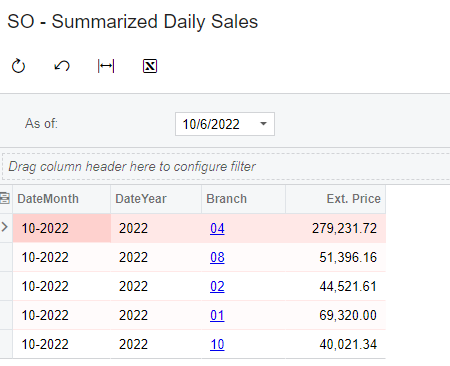
I’d like to display the results of these queries in a table format on a GI, meaning that the GI should have the data in the desired layout prior to exposing it to the Dashboard, but the user should be able to enter a date on the dashboard, that would then feed the GI so that the summarized totals are reflected in the results as though they were entering the date parameter in the GI as shown below where Ext Price = MTD Sales
and no - I don’t want to use a Pivot table… 😉
If anyone has cracked this puzzle, I’m interested in understanding how you did it.