I have a Dashboard that shows a pivot table of item sales, between a Start Date and and an End Date, the pivot is sorted by total sales $ descending.

The user would like to be able to export the data from the pivot table to excel.

From what I have been able to find it appears the only way to do this is to click on the pivot table header and export the data from the drilldown.

The problem is the underlying Generic Inquiry is used for other displays on the dashboard and when the drilldown is used the output has many more columns than the user needs or wants.

Is there some other way to export the data directly from the pivot bale? 

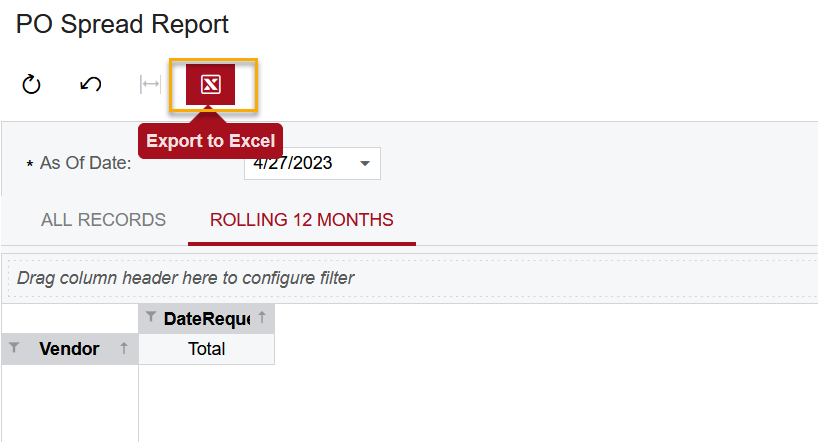
Hi @Del you don’t need to drill further down, you can just view the pivot table and press export button:


estebanperalta54

First of all Thank You for the quick reply,

The problem I have found with your suggestion is that pivot table shows all data for all time, not the data for the date range selected on the Dashboard.

This brings me to 2 quetions:

  1. Is there a way to pass the date range from the dashboard to the underlying GI?
  2. Is there a way to add just the pivot table as a link on the dashboard?

Thank you!


Hi @Del,

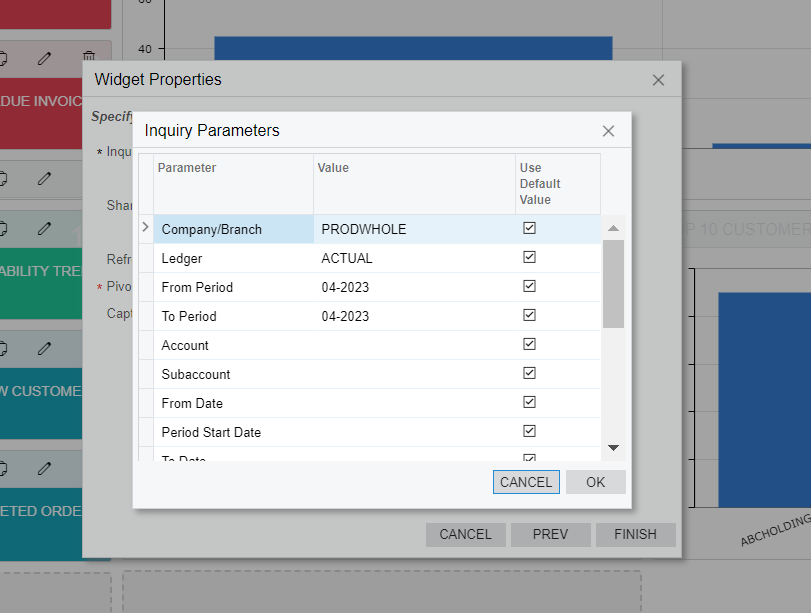
  1. Yes, there is a way to pass the date range.
  • In the Dashboard →  Add new widget → Select Pivot table → In that select Inquiry parameter and add Date range (refer below screenshot).
Date Range


2.To add only the pivot table as a link on the dashboard, you can create a new widget in the dashboard and choose the Pivot Table widget type. Then, configure the pivot table settings to show the required data and apply any necessary filters or parameters. Finally, position the widget on the dashboard where you want it to be displayed.

Hope, it helps!

Regards,

Sweta


Reply