Hi Acumatica community!
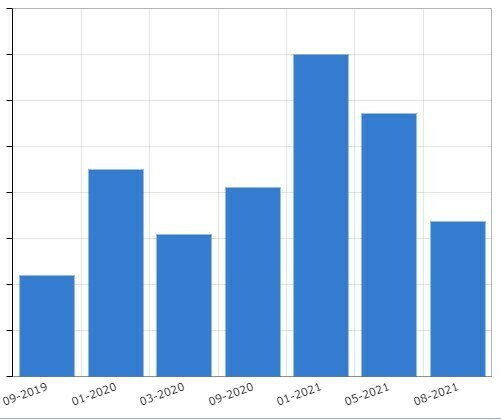
I have a column chart in a dashboard that shows sales by month for individual customers. The column chart only displays months with sales data, which is a problem as many of our customers order every second month or quarterly. See example below.
If there are no sales in a given month, I’d prefer that the chart showed zero (a blank space) for that month. This would make it much easier to see the relationship between sales and time.
Is that possible in Acumatica?


