I am not sure if this is possible, it seems I would need two value options for this.
I would like to create a combined chart that would shows a Sales Persons Monthly Revenue and Monthly Margin Dollars.
I have both these amounts already stored in a UDF Field in projects.
UDF Fields that are Important:
Booked Date
Margin $
Quoted Amount
Is this possible to create a report that would show these data by month side by side.
Best answer by bwhite49
You can do this, but the solution is a little weird.
Basically, you will need to multiply your GI lines by however many columns you want in the series. Attributes are perfect for this. There is also a native table called PMReportRowsMultiplier if you only need two rows, but I prefer an attribute.
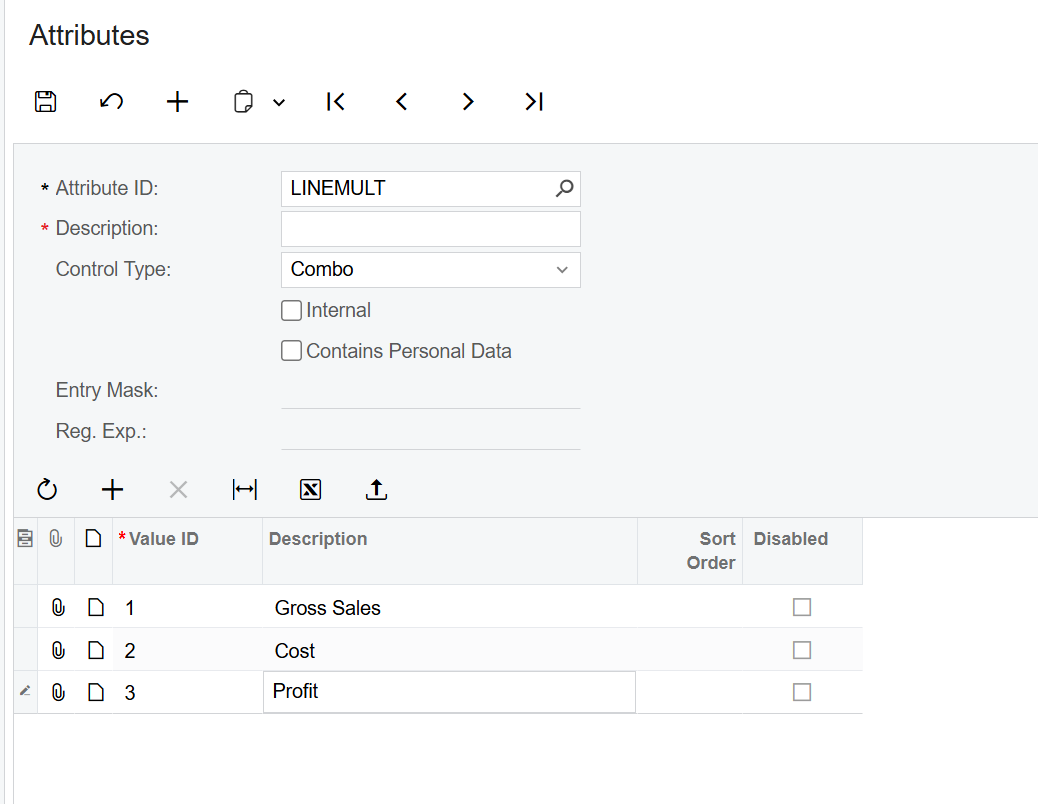
For the attribute solution, say you wanted your chart to have 3 columns to show gross sales, cost, and profit on sales orders - the attribute setup will look like the screenshot below (A combo box with 3 values. The description will be your chart categories)
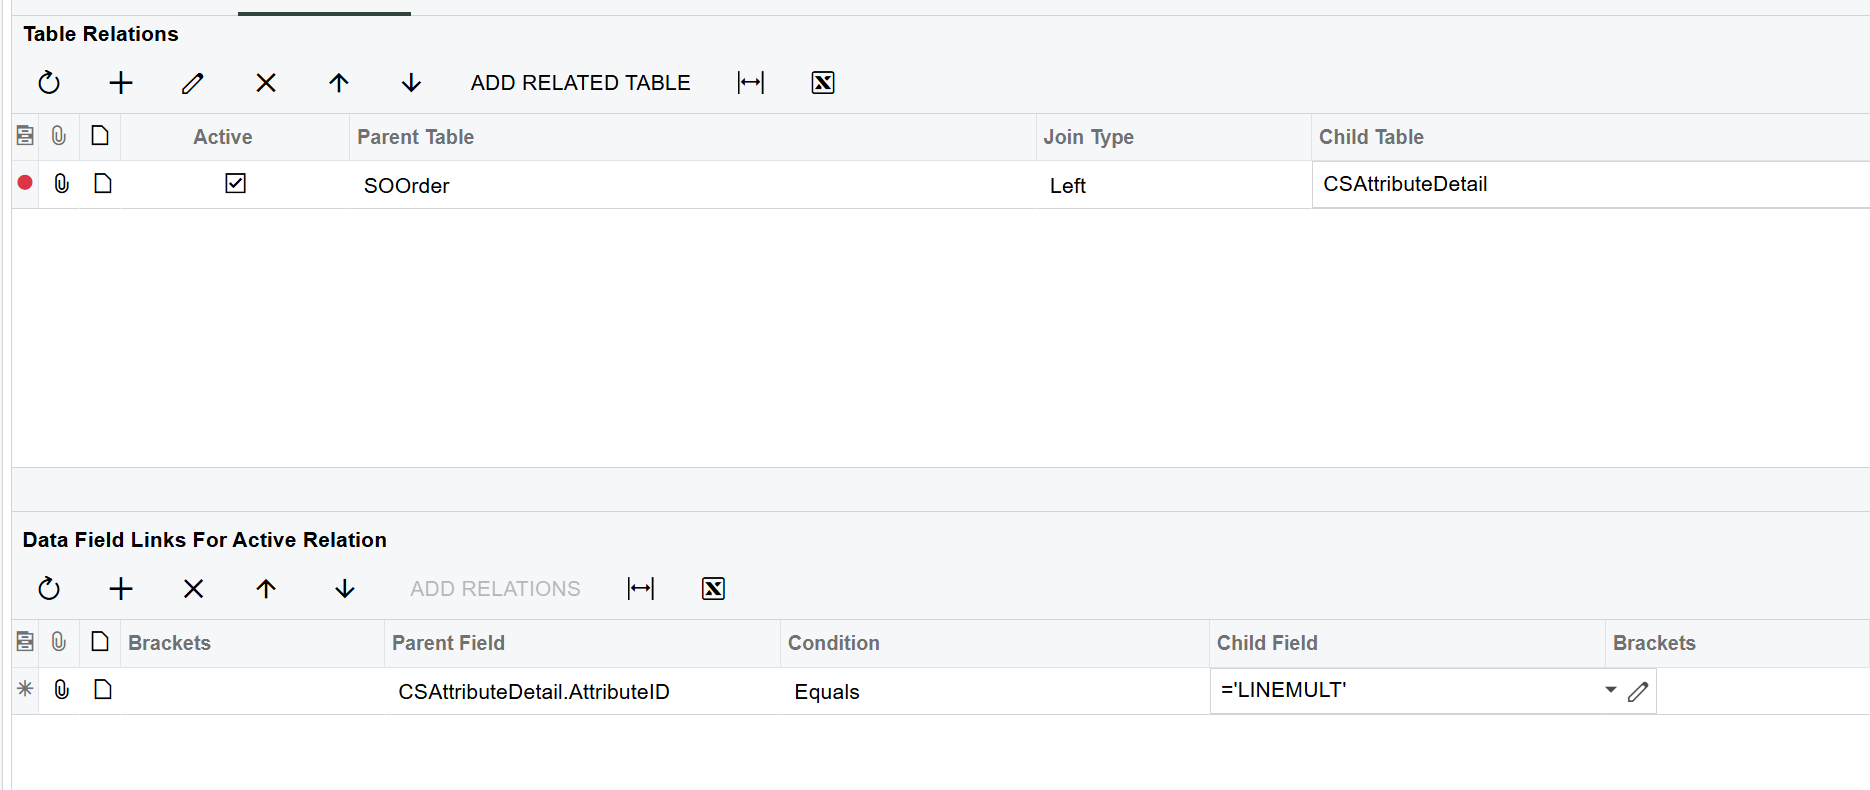
Next you will connect your attribute to your table with a join that looks like this…
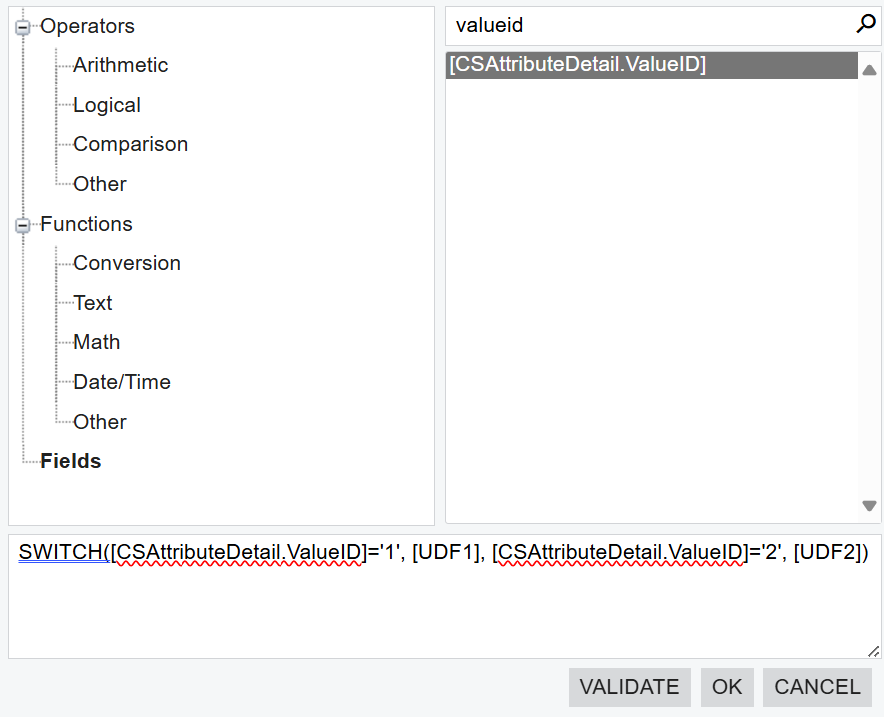
Next you will write a formula. An IIF or a Switch formula that swaps the value of your UDFs depending on which row the UDF is associated with...
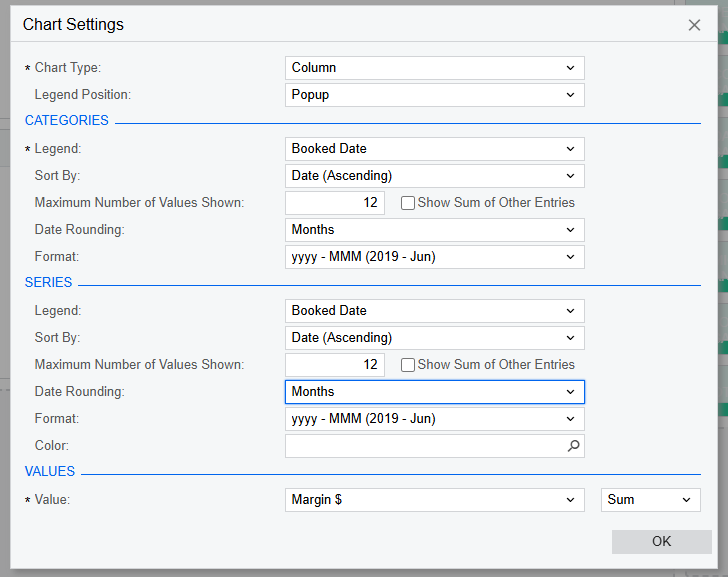
From here, you will use this new calculated field as the value in your chart and you will use AttributeDetail.Description as your chart series.
You can, it would just be a little extensive and might take a bit longer to load. You would need to join your table somehow to make so that there are two of every record in the GI. My suggestion would be to join it to the DateInfo table with a left join. Make your Parent field simply “=2” and make your Child field “=DateDiff('d', '12/31/1969', [DateInfo.Date])” as shown below.
Then create a field where you use the following formula as the value (substitute your acutal UDF fields)
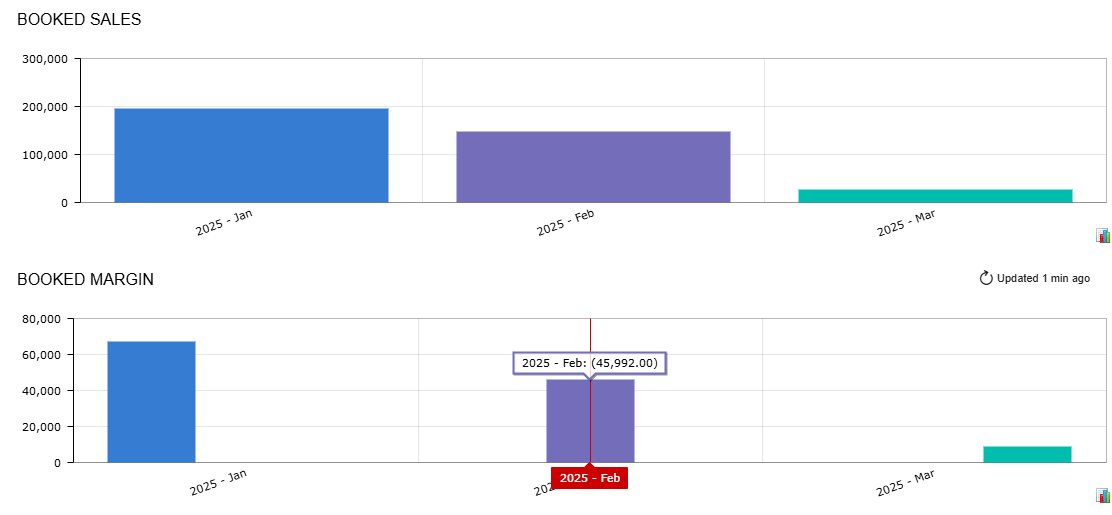
Then, in your Dashboard chart, use the first formulated field as the value and the second one as the series. It will make two columns, one with the booked sales value and the other with the booked margin value. Just make sure this is on a GI that people aren’t going to use outside of the dashboard values as it will have double entries of every line.
You can do this, but the solution is a little weird.
Basically, you will need to multiply your GI lines by however many columns you want in the series. Attributes are perfect for this. There is also a native table called PMReportRowsMultiplier if you only need two rows, but I prefer an attribute.
For the attribute solution, say you wanted your chart to have 3 columns to show gross sales, cost, and profit on sales orders - the attribute setup will look like the screenshot below (A combo box with 3 values. The description will be your chart categories)
Next you will connect your attribute to your table with a join that looks like this…
Next you will write a formula. An IIF or a Switch formula that swaps the value of your UDFs depending on which row the UDF is associated with...
From here, you will use this new calculated field as the value in your chart and you will use AttributeDetail.Description as your chart series.
@bwhite49 I had seen my solution a long time ago and hadn’t really given it much thought on a better way, but you’re way is much cleaner and smarter lol. I will definitely be using that instead from now on
@bwhite49 I had seen my solution a long time ago and hadn’t really given it much thought on a better way, but you’re way is much cleaner and smarter lol. I will definitely be using that instead from now on
Attributes are my go-to solution for everything. I use them as mini-tables to store 1 column of data (description) and 1 key field (value). For example, today I create an automation to store invoice costs in an attribute as ARInvoice does not have a total cost field for whatever reason. As a result, I created a GI that sums up all of the ARTran lines and created an import scenario business event to populate the value field with the invoice nbr and then the description field as the rounded total cost from the GI (decimals for whatever reason make it hard to convert back to a number). From there, you can pull the invoice cost into any report.
I will definitely have to work attributes into my solutions more. I never thought to use them as a backend solution and not just for data entry. Very nice!
We use 3 different kinds of cookies. You can choose which cookies you want to accept. We need basic cookies to make this site work, therefore these are the minimum you can select. Learn more about our cookies.