I did not get to many responses on by last topic, so I’ll try again for some better luck🙂. I would like some help in creating a GI to use with a Dashboard to show Revenue vs Budget Revenue by Quarter. I only want to show all Sales Accounts (4000s).

I did not get to many responses on by last topic, so I’ll try again for some better luck🙂. I would like some help in creating a GI to use with a Dashboard to show Revenue vs Budget Revenue by Quarter. I only want to show all Sales Accounts (4000s).

Best answer by abrunner78
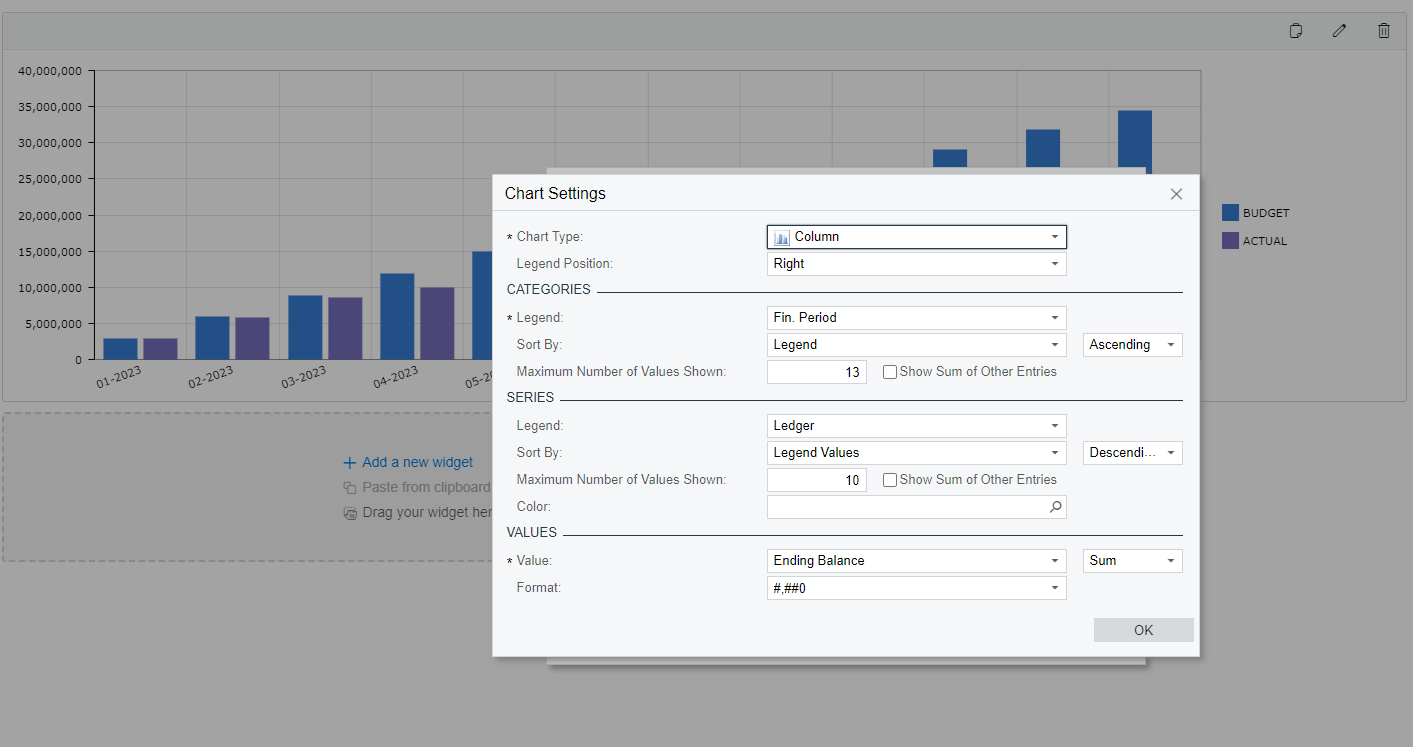
I continued to play around was able to make the following widget:

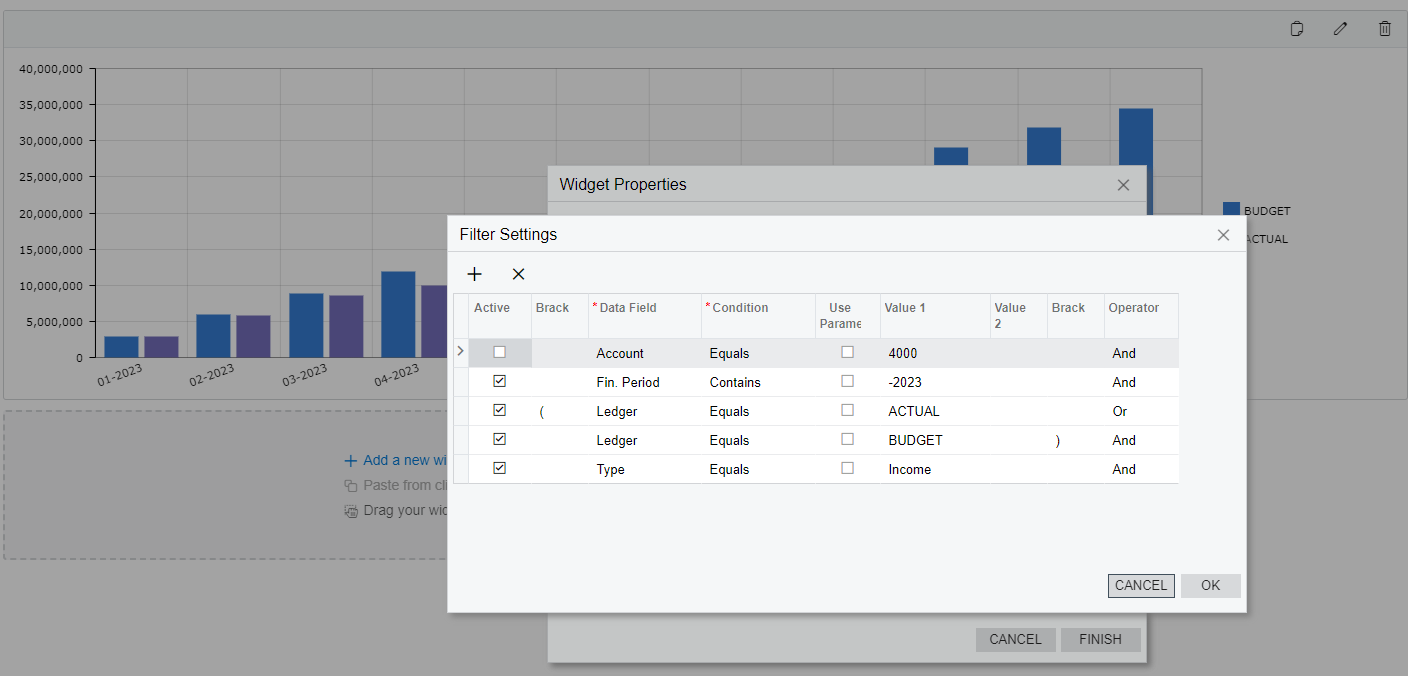
There are some subtle quirks to how I’m filtering, but it seems to be what you were looking for.
Attached the GI and here are some screen shots of the widget configuration:


Let me know if this is what you were hoping for.
Enter your E-mail address. We'll send you an e-mail with instructions to reset your password.