Is it possible to create a report that shows the difference between AP and AR from the same vendor. (i.e the vendor is also the customer).
Solved
AP and AR Difference
Best answer by bryanb39
Do you need a report? Or will a Generic Inquiry work? Either way, starting with a GI is an easy way for proof of concept.
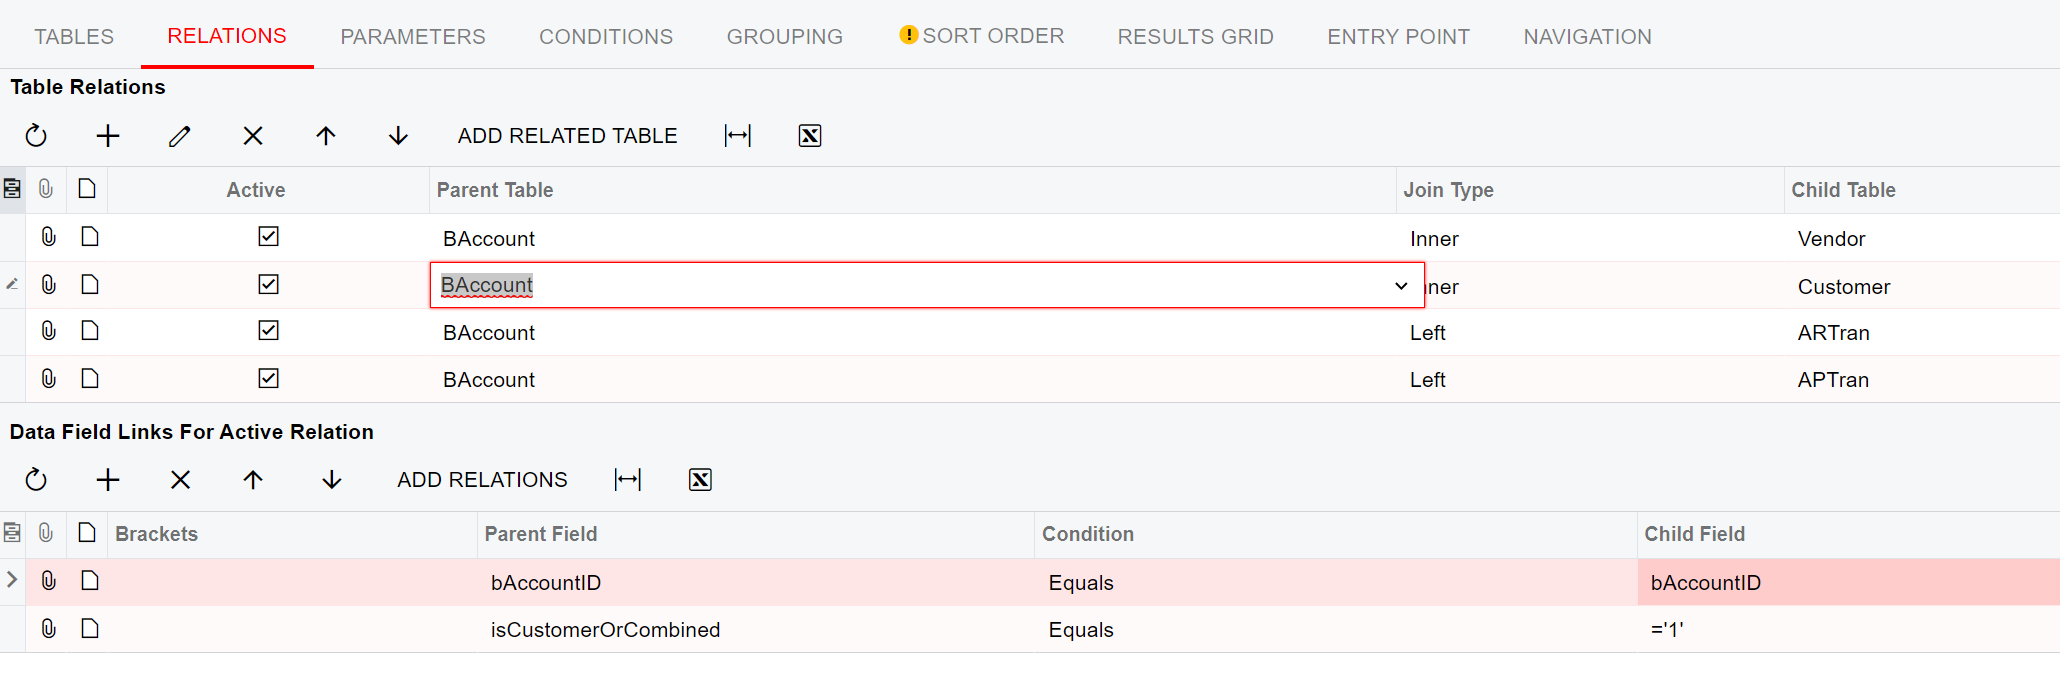
When customers and vendors are extended they share the same BAccountID.
Start with the BAccount Table and join to Vendors and Customers, then left Join BAccount to the respective tablse, ARTran and APTran for example, or Payments using BAccountID.
To return only those that are extended, you can simply add an inner join between Vendor and Customer with BAccountID or add isCustomerOrCombined to the BAccount - Vendor and BAccount - Customer relationships.
If you did not extend all, you can leave the isCustomerOrCombined off and create relationships using Parent/Child relationships or even an attribute to get the rest, this may require some self joins. Let us know if you need help with that. This may also slow down your GI significantly with high volume of records.
Then you can join BAccount to APTran, ARTran, Payment, etc.
Once you feel good about your relationships and tested out some formulas, you can:
Create a Pivot Table from the GI for easy side by side comparisons.
Create a Dashbaord so you can plot some bar and line charts and display the Pivot Table.
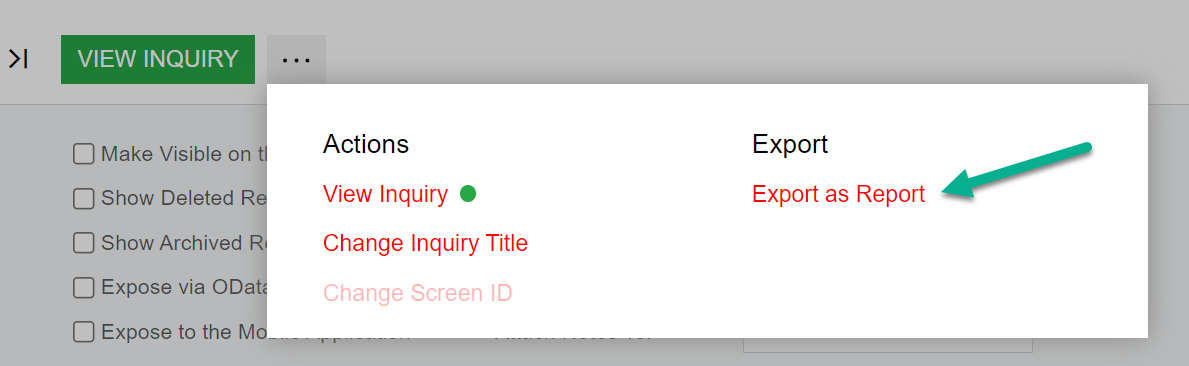
Or export the GI as a report if you want to use a report for some more advanced comparisons.
You inspired me to do the same in my environment, this can be very useful. In my case many were not extended so I’ll likely be adding an attribute.


Login to the community
No account yet? Create an account
Social Login
Login with your Acumatica accountEnter your E-mail address. We'll send you an e-mail with instructions to reset your password.