Solved

This year order count vs last years order count by month

  • June 6, 2024
  • 1 reply
  • 52 views

Forum|alt.badge.img
  • Freshman I
  • 42 replies

I have a request for a bar chart  or a pivot table on a dashboard that will show This Years Order Count vs Last Years Order Count by month for a specific customer.

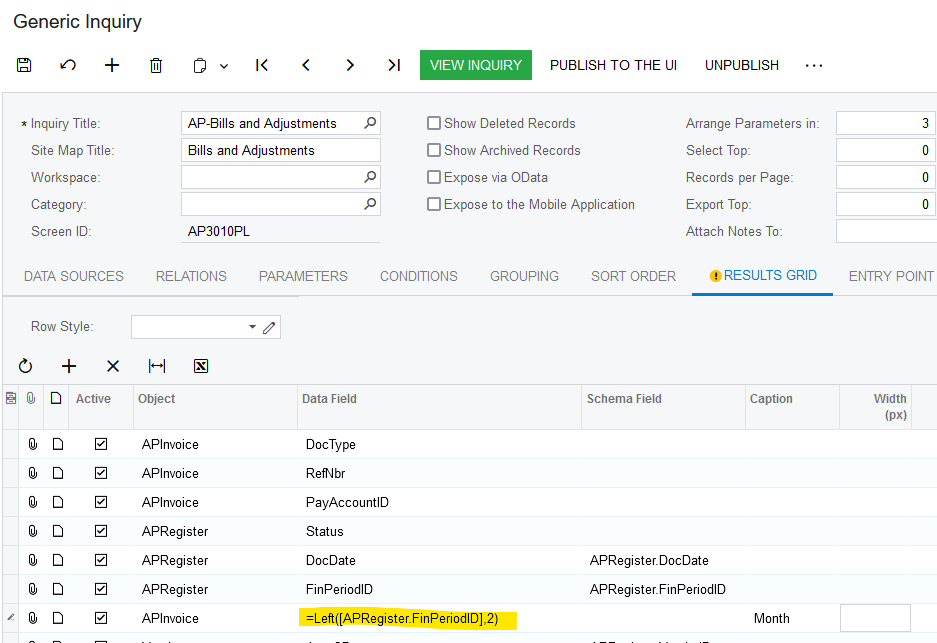
I have a Generic Inquiry that Pulls the Customer Name, the Posting Period and the Order Number for last year and this year. 

When I create a bar chart or a pivot table the data is show sequentially January 2023, February 2023, March 2023…….. December 2023, January 2024, February 2024….. etc.

Is there a way to either have a bar chart or pivot table where January 2023 and January 2024 would be side by side, followed by February 2023 and February 2024 and so on.

Thank you


Best answer by Laura02

Hello @Del ,

Could you add a Month column to the Generic Inquiry with a formula like Left(Posting Period fieldname, 2) and then sort by two fields - the month and then posting period?


View original
Did this topic help you find an answer to your question?

1 reply

Laura02
Captain II
Forum|alt.badge.img+19
  • Captain II
  • 3132 replies
  • Answer
  • June 6, 2024

Hello @Del ,

Could you add a Month column to the Generic Inquiry with a formula like Left(Posting Period fieldname, 2) and then sort by two fields - the month and then posting period?


Reply


Cookie policy

We use cookies to enhance and personalize your experience. If you accept you agree to our full cookie policy. Learn more about our cookies.

 
Cookie settings