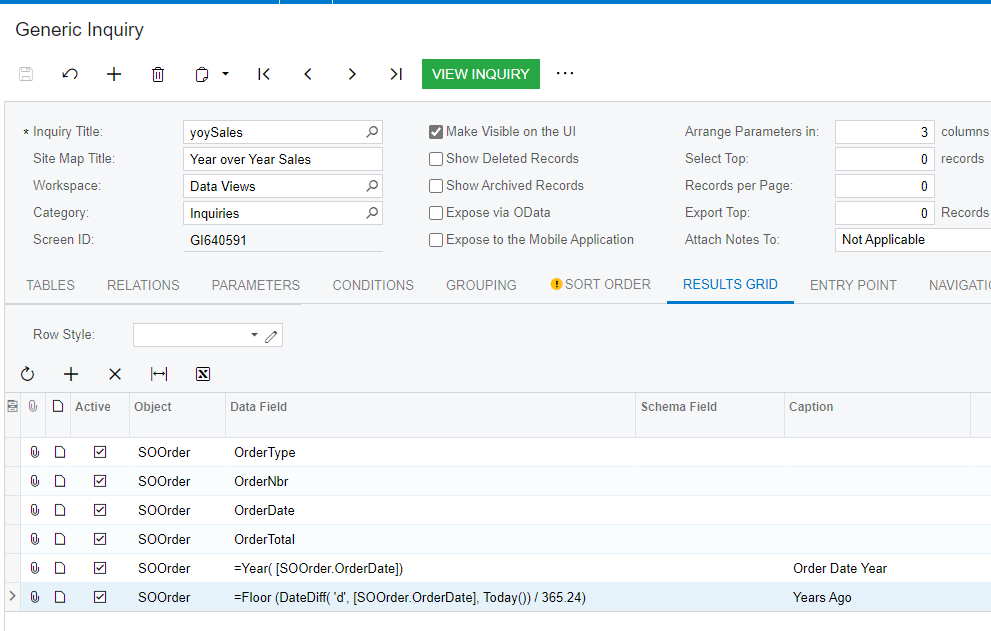
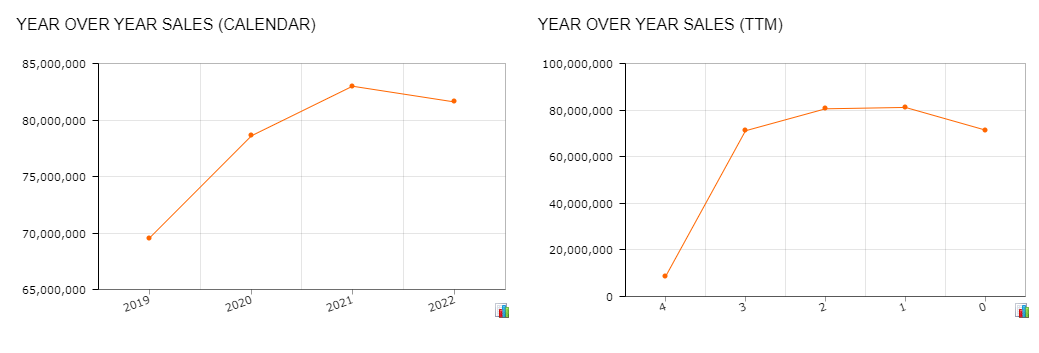
Whatever you want to show on axises will need to be in one column. So in your case you will need 2 columns in your result grid (of course you can have more columns but for sake of DB I mean). One column is going to be Year and another one Amount or Quantity. The qry or amt is straight forward. For the year column you will need to use a formula that extracts the fiscal year based on a fixed value comparison or a cutoff month parameter. Possibly the easiest way is to get the left 4 digit of TranPeriod or FinPeriod. Something like =Left(DAC.TranPeriodID, 4) or get year from DocDate something like =Year(DAC.DocDate)
In DB then you will use this formulated column let say you call it Year, as axis and Amount as value and you can have a comparison column chart


