First, I’m sorry if someone else asked this before, but I didn’t find my answer. My company has an excel file where we do this for all plant and 3 separate branches:
Orders $
Sales $
Scheduled sales $
Total backlog $
Total past due $
# Employees
Weight shipped
The file has other columns as well, but this is enough for an example. There is some math behind those columns, taking the total from a week or the total from a report, for each branch.
Is there a way of creating this in Acumatica? What I do today is filling the excel with the results I take from Acumatica.
Thanks in advance, have a good day.
Best answer by bwhite49
There are a few ways to do this in Acumatica. You could create a custom report through the Acumatica report designer tool that calculates and summarizes information. This has a steep learning curve, so I would not suggest trying this first.
You could make a generic inquiry that summarizes and calculates information through formulas and grouping functionality. This is a bit easier to put together than building a report, but there is a still a learning curve.
You can also create pivot tables on top of a generic inquiry that lists all of the raw data. This is what I recommend you try first.
The sales order list that you are summarizing is an Acumatica generic inquiry, so you can create your pivot table using this screen/GI in your screenshot.
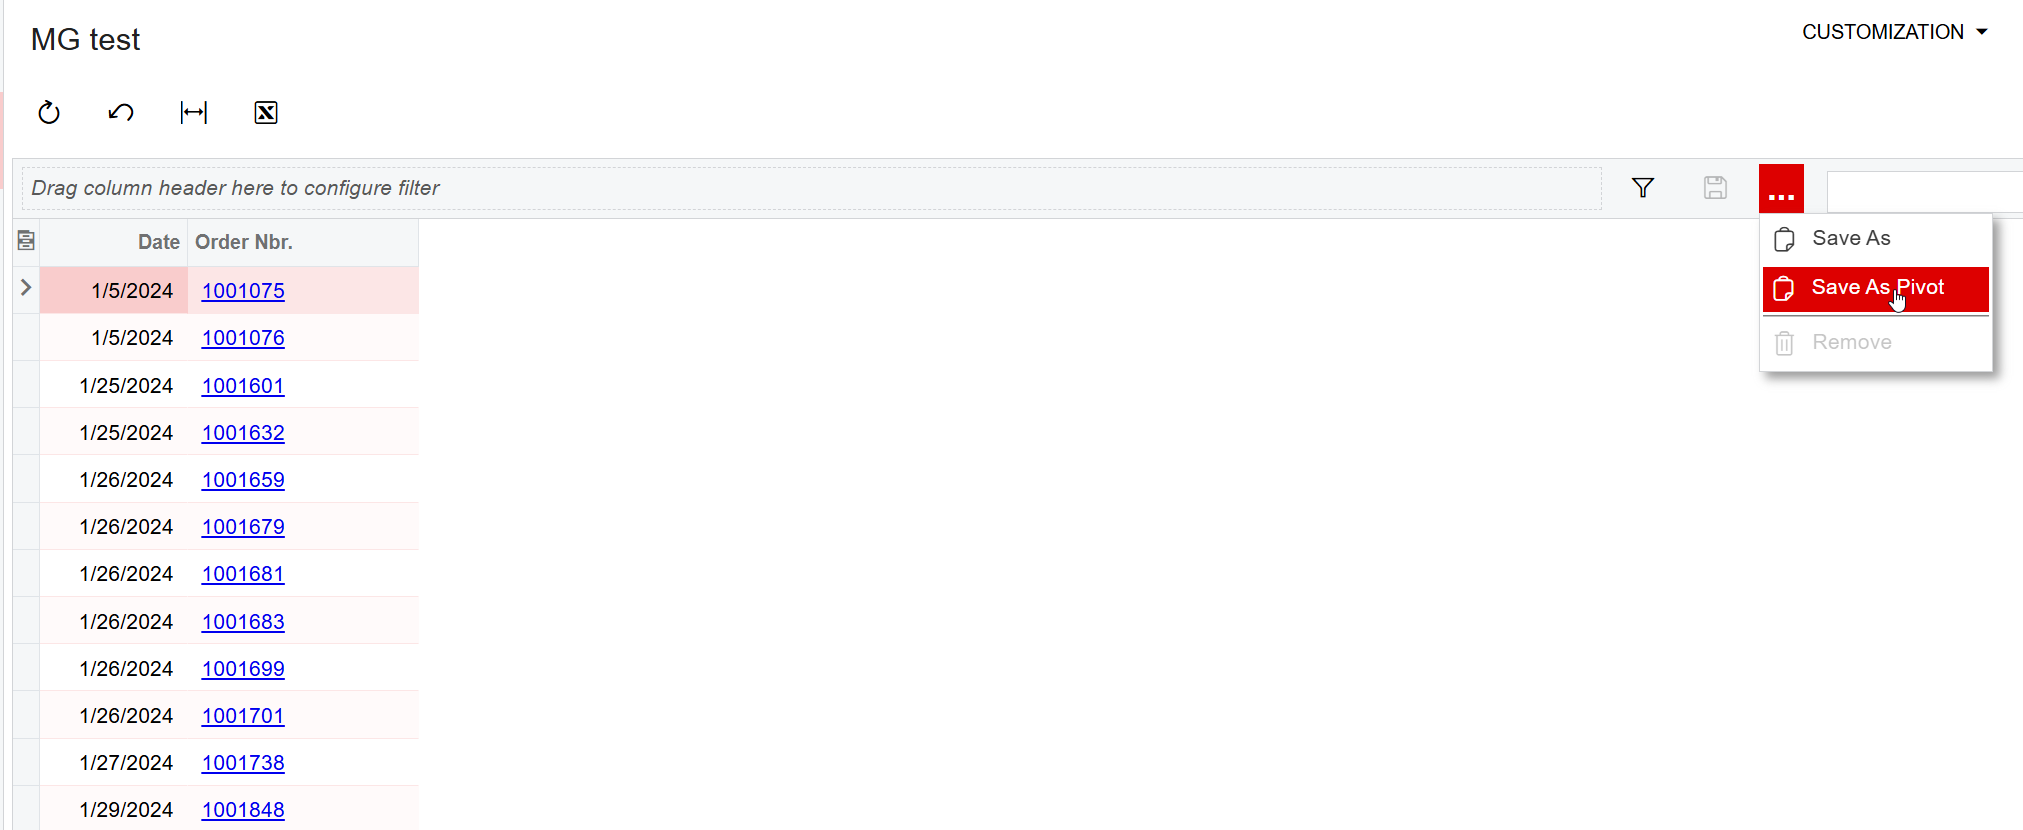
To create a pivot table, click on the 3 dots on the right side of the screen, and then click “save as pivot”
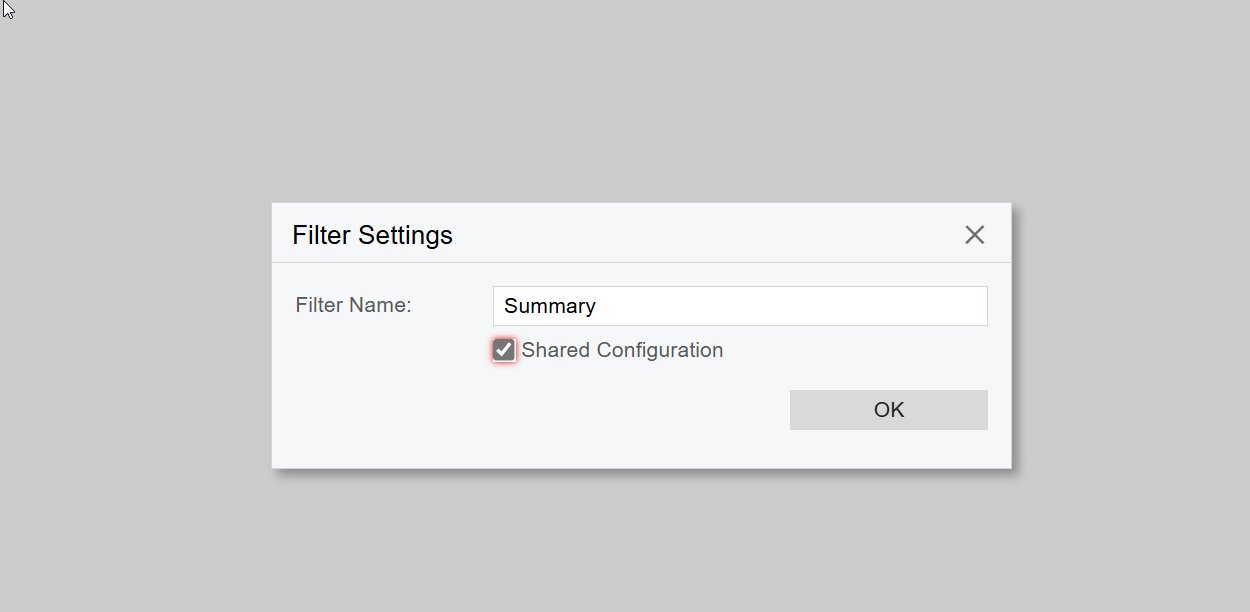
Give the pivot table a name and then click on “shared configuration”
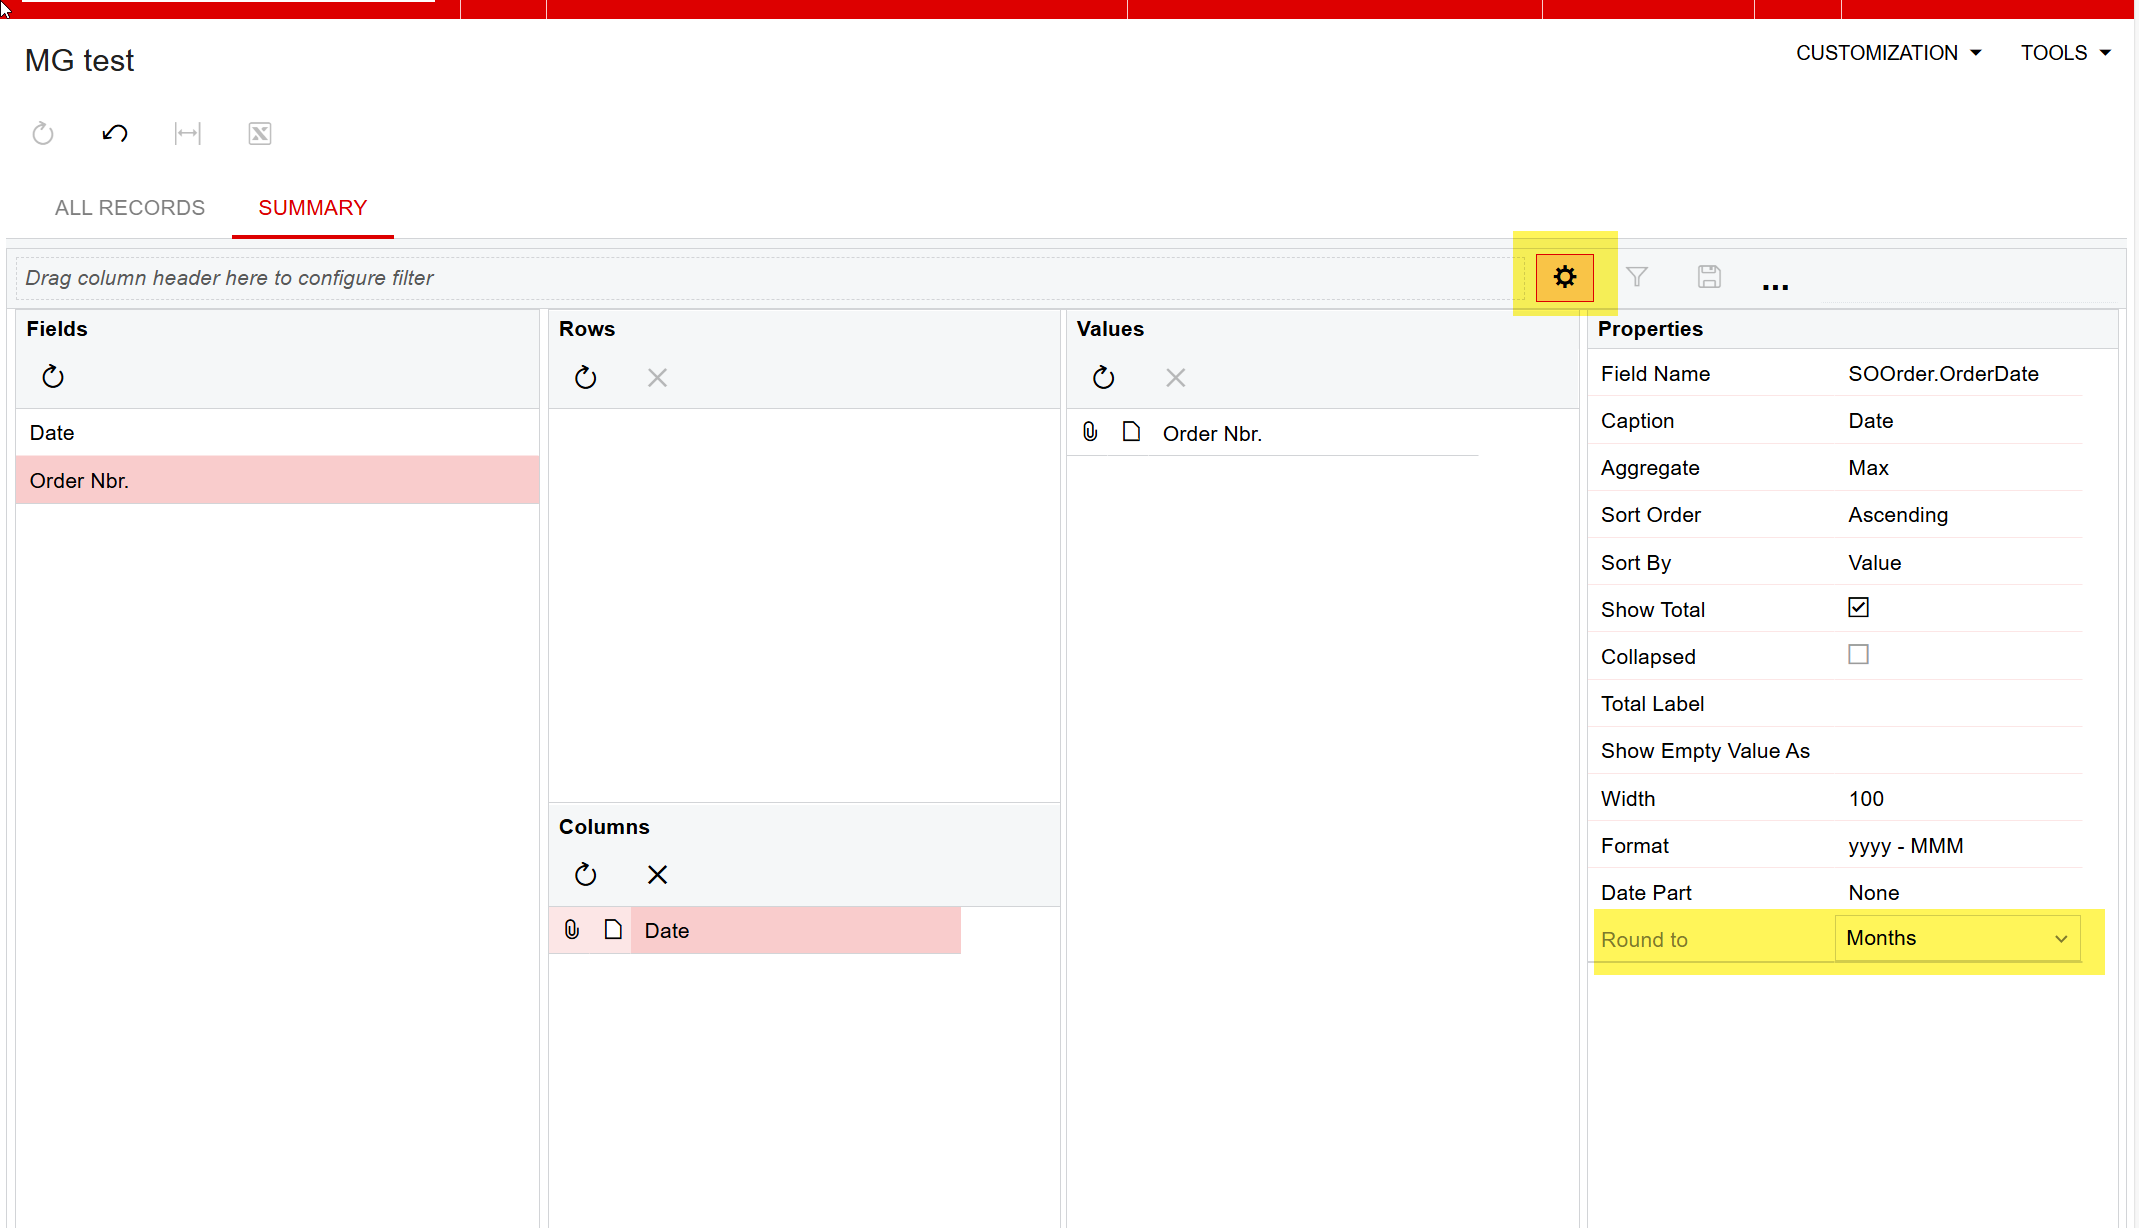
From here you just need to drag a drop your fields and modify a few settings. What you want to do is add your branch field as either a row or a column, so drag that field into one of those two places. After that, you can drag your date field and modify the “round to” to be a specific date period. This will summarize data for that time period.
You can drag your order nbr field as a value and have it count the number of orders. If you drag your order total field into the value section, it will sum up the sales amount.
To save the pivot table, just click on the gear icon highlighted above.
This is going to create a filter pivot table which can be run whenever a user runs this inquiry. You can also make a pivot table directly from the pivot table screen.
A pivot table created through the pivot tables screen can be used in dashboards and exist as it’s own on the site map. A filter pivot table can not.
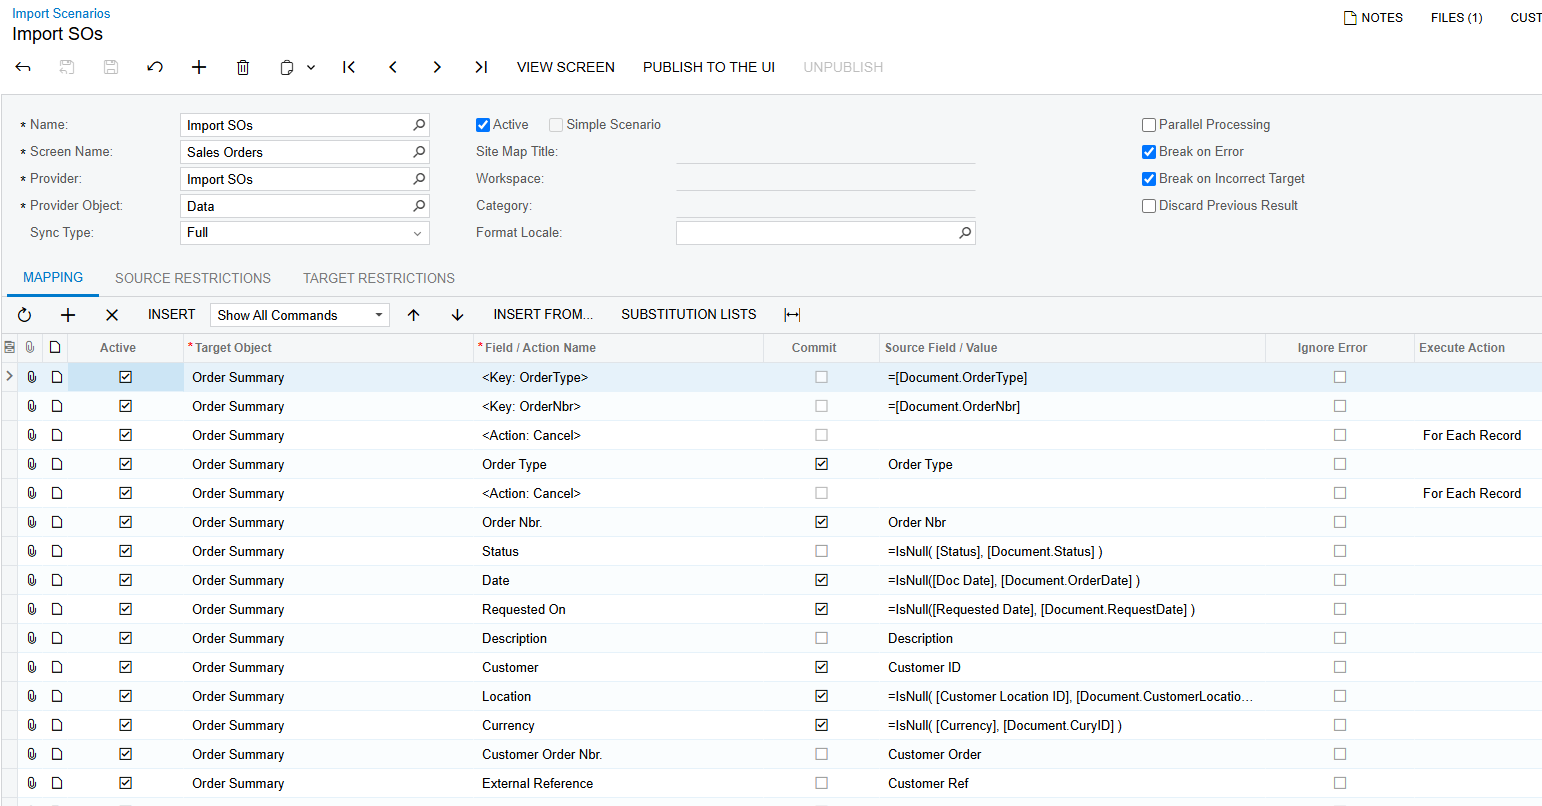
Acumatica has the "Import Scenarios" feature. It seems that all the screens that Acumatica has you can import data from an Excel file into. Depending on your specific data import needs, you will create an Excel template file to import the data.
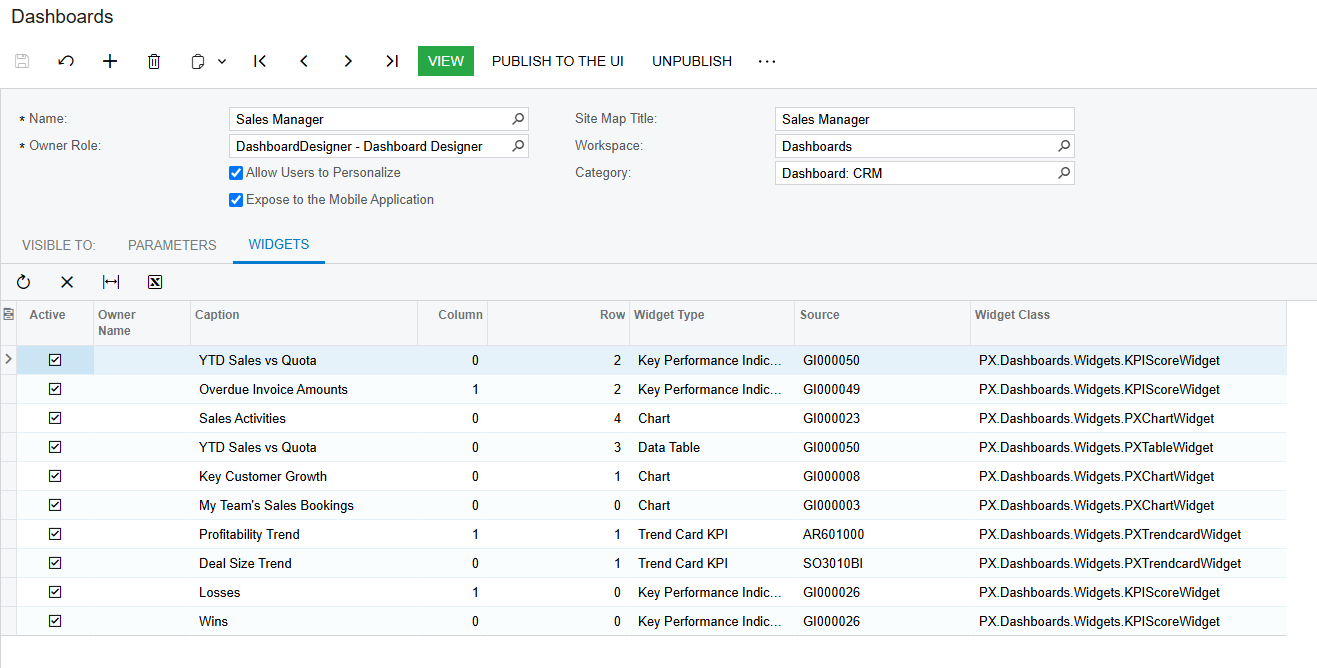
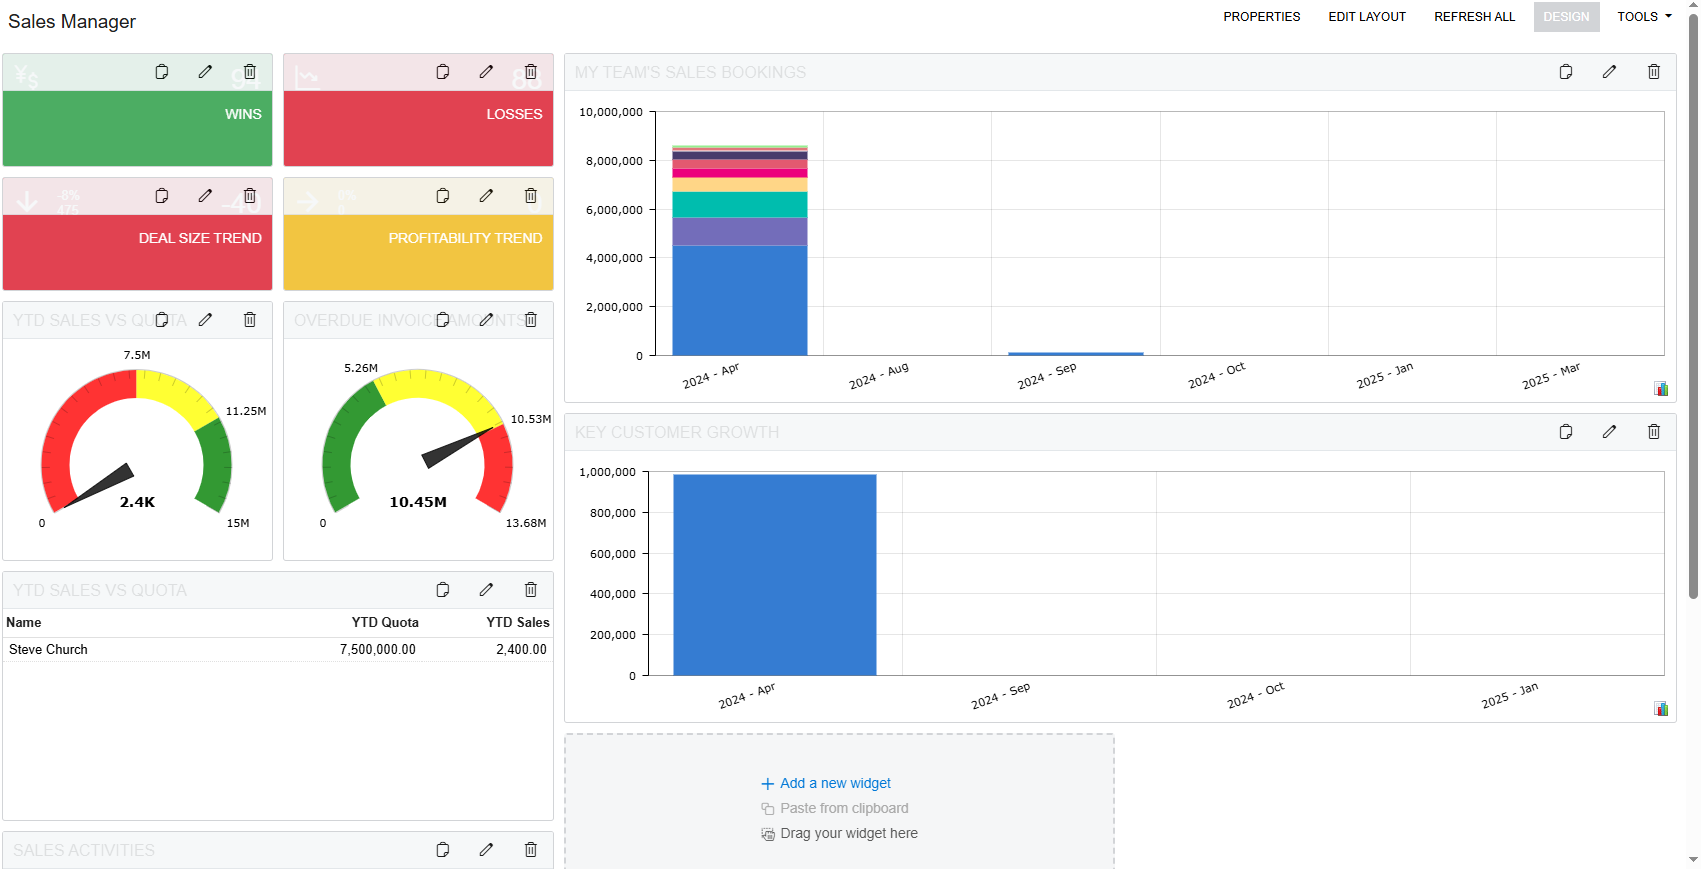
And Acumatica also has a "Dashboards" feature for you to view data visually with images, charts.
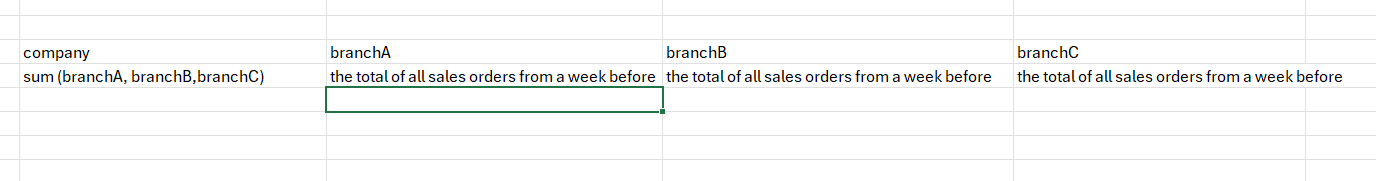
Thanks for the reply, but this is not what I tried to say. I will explain more. We have an excel like this
What I want to do is to have that directly in acumatica instead of filling the excel.
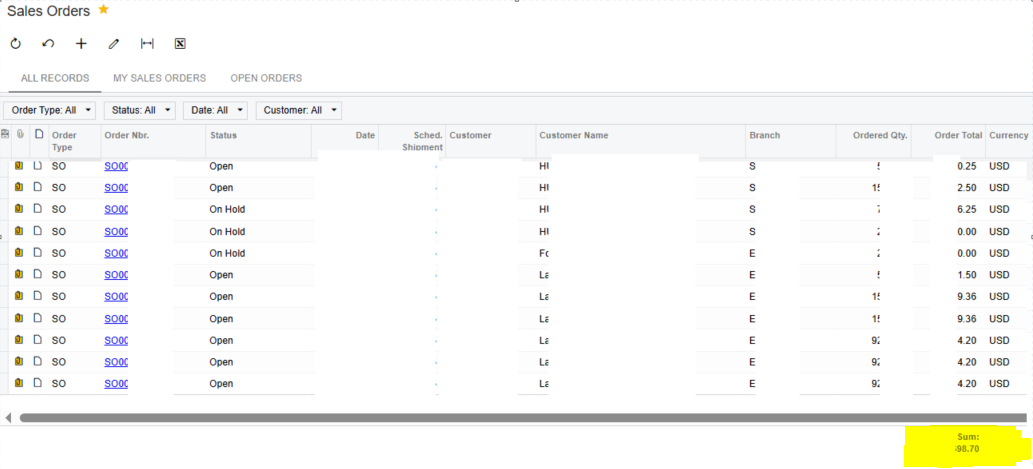
What I’m currently doing is filling that excel like this:
I pick the sum and enter that number into the excel file
But I would like to create a screen in acumatica to automatically fill those columns with the different values I need. Is there an option for doing that?
There are a few ways to do this in Acumatica. You could create a custom report through the Acumatica report designer tool that calculates and summarizes information. This has a steep learning curve, so I would not suggest trying this first.
You could make a generic inquiry that summarizes and calculates information through formulas and grouping functionality. This is a bit easier to put together than building a report, but there is a still a learning curve.
You can also create pivot tables on top of a generic inquiry that lists all of the raw data. This is what I recommend you try first.
The sales order list that you are summarizing is an Acumatica generic inquiry, so you can create your pivot table using this screen/GI in your screenshot.
To create a pivot table, click on the 3 dots on the right side of the screen, and then click “save as pivot”
Give the pivot table a name and then click on “shared configuration”
From here you just need to drag a drop your fields and modify a few settings. What you want to do is add your branch field as either a row or a column, so drag that field into one of those two places. After that, you can drag your date field and modify the “round to” to be a specific date period. This will summarize data for that time period.
You can drag your order nbr field as a value and have it count the number of orders. If you drag your order total field into the value section, it will sum up the sales amount.
To save the pivot table, just click on the gear icon highlighted above.
This is going to create a filter pivot table which can be run whenever a user runs this inquiry. You can also make a pivot table directly from the pivot table screen.
A pivot table created through the pivot tables screen can be used in dashboards and exist as it’s own on the site map. A filter pivot table can not.