Solved

Dashboard graphs resizing

  • November 22, 2024
  • 5 replies
  • 48 views

Forum|alt.badge.img
  • Freshman II
  • 10 replies

Hi,


Following an update overnight my dashboard graphs spotted working. I have created/modified reports and have been able to recover most of them.


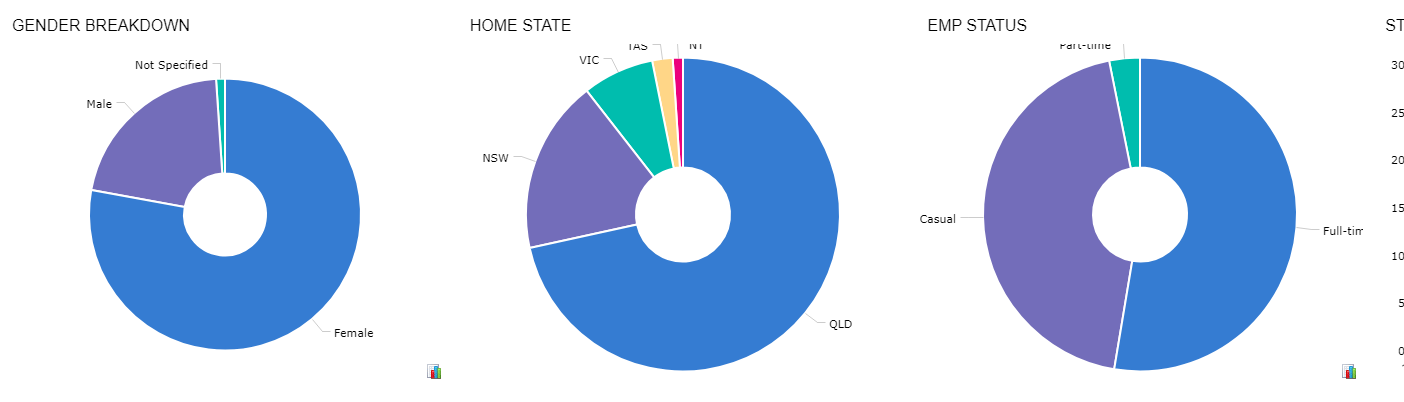
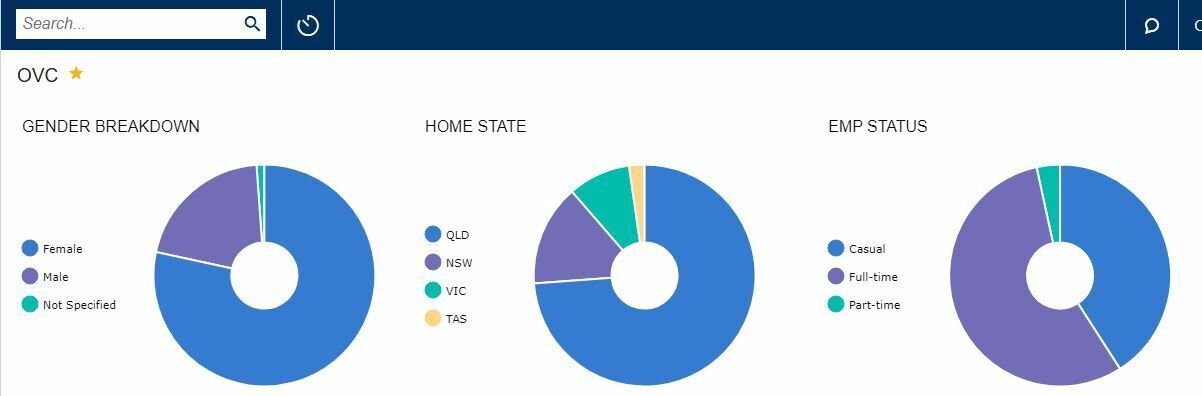
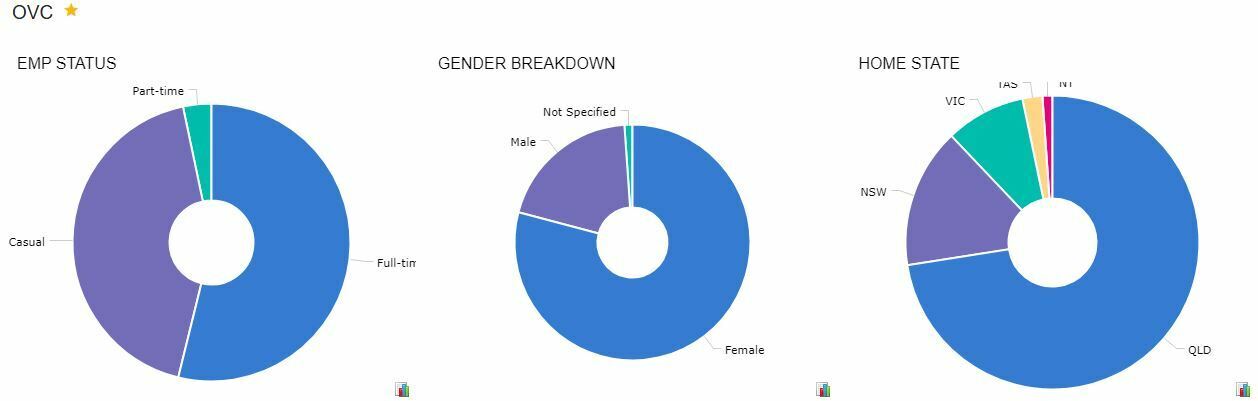
I have an odd issue with the system automatically sizing my doughnut graphs:

  • my Gender Breakdown graph is perfect
  • Home State graph (without a popup legend, as a test) cuts off the names of the states at the top
  • Employment Status graph (with popup legend) also cuts off names at top and sides.

Also of note, the size of the doughnut are different.

All parameters are the same.


How can I fix this?


Best answer by CCC

Kinda of... I continuiously resized these pie charts, graphs beside/below them, turning the ledengds on and off, etc. I finally managed to find a common sizing.

It resolved this problem, maybe not a permanent solution :)

Dashboard


View original
Did this topic help you find an answer to your question?

5 replies

Laura02
Captain II
Forum|alt.badge.img+19
  • Captain II
  • 3132 replies
  • November 22, 2024

Hello,

Instead of re-posting the same question on a new thread, please “Bump” your prior question by posting to it again, instead of creating duplicate identical threads.


To help us answer, you could add to the previous thread (or to this copy):

  1. Your current Acumatica Version
  2. The Acumatica version  you upgraded from
  3. Your Browser and Browser version
  4. Did you try alternate browsers? If yes, name at least one other.
  5. Whether you’ve cleared browser cache (deleted browser history) since the upgrade, and whether clearing browser cache helped in any way.
  6. Control + and  Control - can be used to resize some browsers. If you use Control+ s or Control - do your widgets look better?

Your post with additional information will boost your thread to the top of the unanswered list.

Thank you, and good luck!

Laura


Chris Hackett
Community Manager
Forum|alt.badge.img
  • Acumatica Community Manager
  • 2754 replies
  • November 22, 2024

Hi ​@CCC  - I have removed the duplicate post


Forum|alt.badge.img
  • Author
  • Freshman II
  • 10 replies
  • November 26, 2024
  1. Build 2023.118.502.1612 [23.118.0016]
  2. I’m not certain but I think it was 2023.1.1
  3. Chrome, Version 130.0.6723.59 (Official Build) (64-bit)
  4. Microsoft Edge for Business, Version 131.0.2903.63 (Official build) (64-bit)
  5. No, clearing cache and cookies did not resolve
  6. Zooming to 150% resolved the issue, but not practical to be using browsers at that size.

One of the graphs works fine, even swapping their positions does not help:

I have other posts awaiting help & suggestions - I’ll bump those as advised.


Chris Hackett
Community Manager
Forum|alt.badge.img
  • Acumatica Community Manager
  • 2754 replies
  • January 23, 2025

Hi ​@CCC were you able to find a solution? Thank you!


Forum|alt.badge.img
  • Author
  • Freshman II
  • 10 replies
  • Answer
  • January 23, 2025

Kinda of... I continuiously resized these pie charts, graphs beside/below them, turning the ledengds on and off, etc. I finally managed to find a common sizing.

It resolved this problem, maybe not a permanent solution :)

Dashboard


Reply


Cookie policy

We use cookies to enhance and personalize your experience. If you accept you agree to our full cookie policy. Learn more about our cookies.

 
Cookie settings