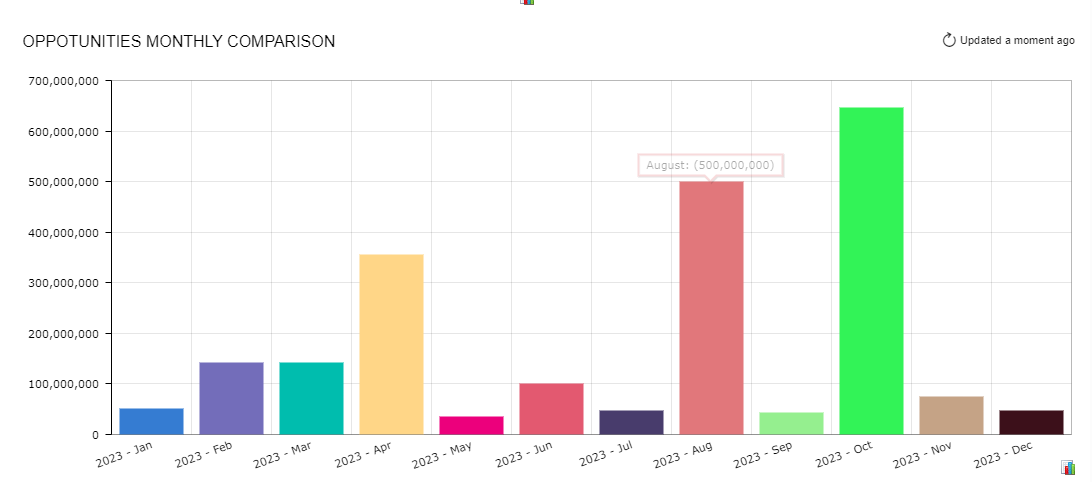
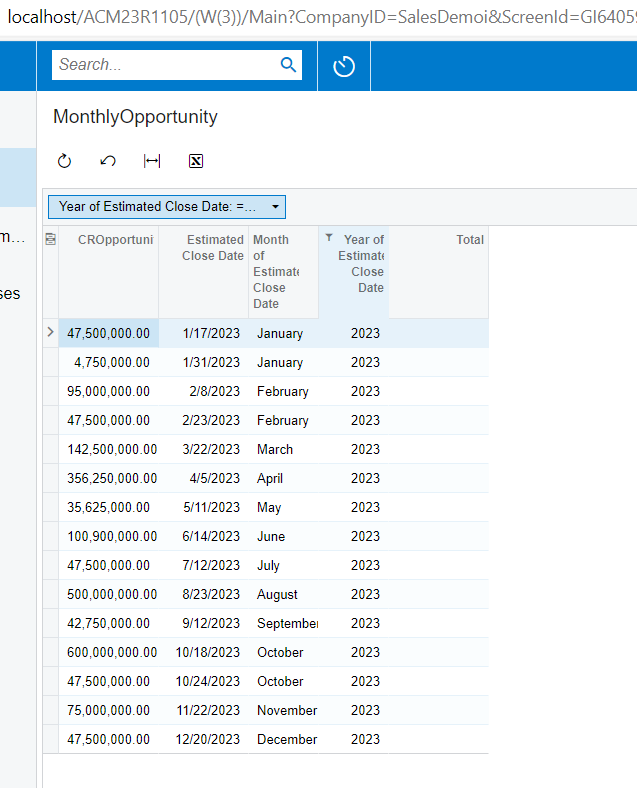
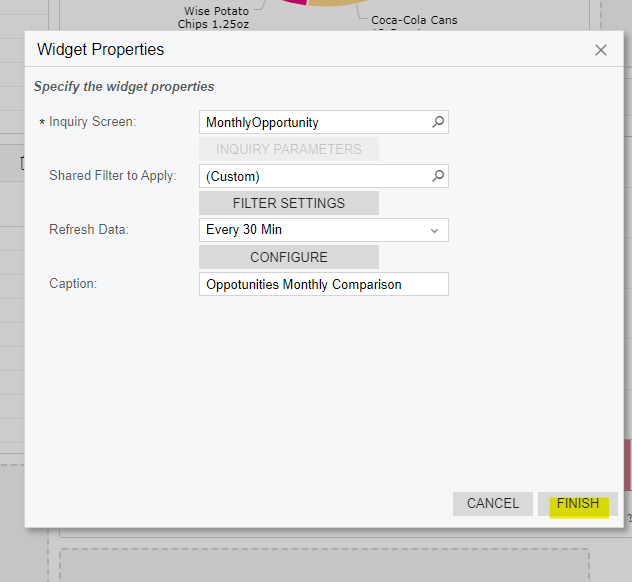
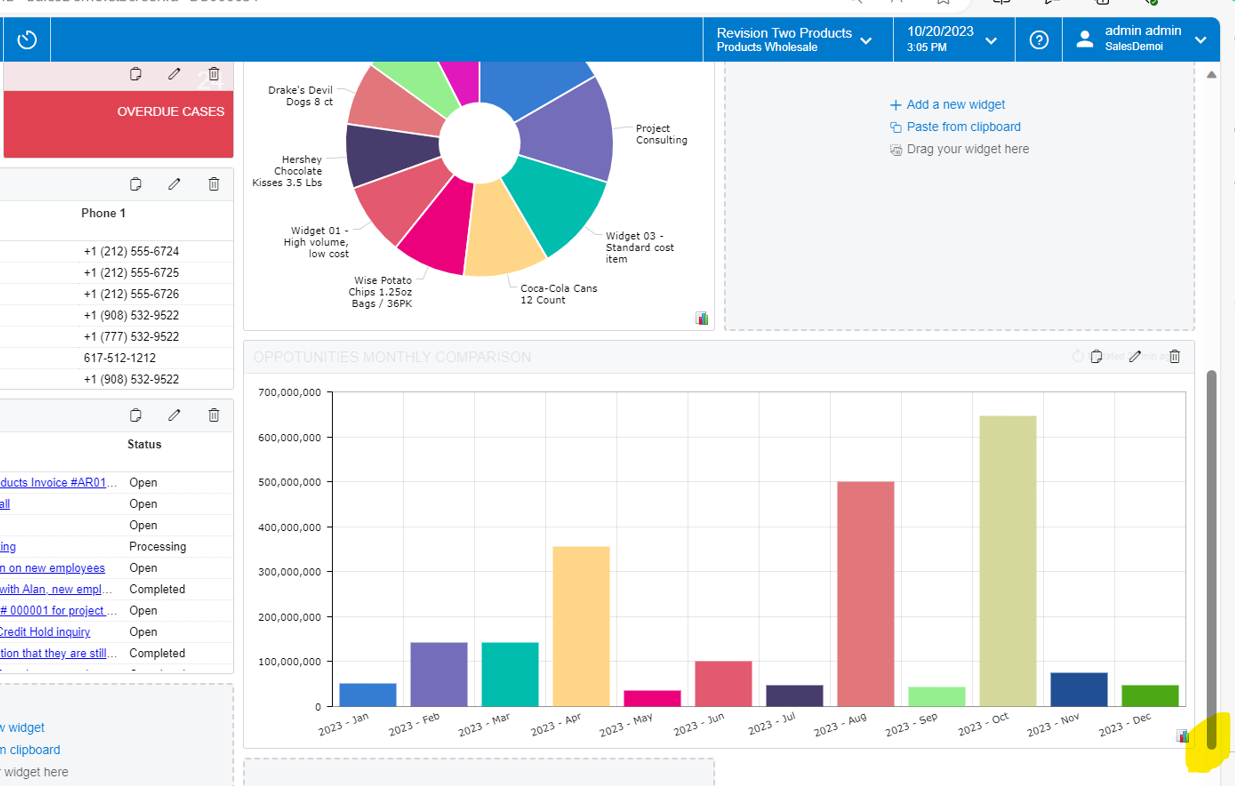
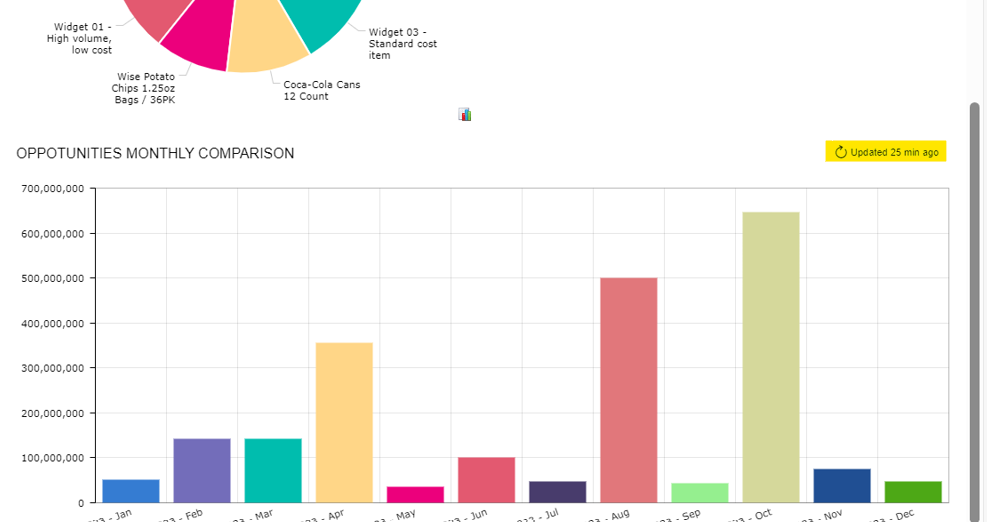
Use-case: Plot using a line or bar chart widget on a dashboard the monthly cumulative total amounts for won opportunities (Acumatica CRM), e.g Jan through Dec, 2023. Anyone have an example GI configuration illustrating how to do this?
Monthly cumulative line or bar chart for non financial/GL information
Best answer by ejmillar
Hi John,
I’ve found a solution to create a cumulative total.
However, Acumatica will need to be updated to 2024 R1.
The 2024 R1 update allows the ability to create a GI from another GI and I’ve used this technique to create a cumulative total for the opportunities.
The first step is to create a simple GI called ‘MonthlyOpportunityTotal’ that aggregates each month's opportunity amount.
Data sources:
CROpportunity
DateInfo
Relations
DateInfo.date Inner Join CROpportunity.closeDate
Conditions
CROpportunity.Status = ‘Won’
CROpportunity.CloseDateYear = 2014 (I’m using the sales demo system and 2014 has data)
Grouping
DateInfo.Month
Sort Order
DateInfo.Month
Result Grid
DateInfo.Month AS OppMonth
CROpportunity.Amount SUM Aggregation AS MonthlyTotal
The results should look like the below:
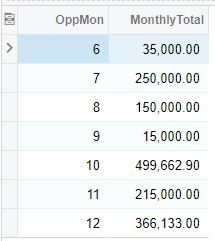
In the second part, a new GI needs to be created, which pulls in the GI above to calculate the cumulative total.
In Acumatica 2024 R1, we can now add a new GI as a datasource to a GI.
Datasource
MonthlyOpportunityTotal Alias MonthlyOpportunityTotal
MonthlyOpportunityTotal Alias MonthlyOpportunityTotal2
Relations
MonthlyOpportunityTotal.DateInfo_Month Is Greater Than or Equal To MonthlyOpportunityTotal2.DateInfo_Month
Grouping
MonthlyOpportunityTotal.OppMonth
MonthlyOpportunityTotal.MonthlyTotal
Sort Order
MonthlyOpportunityTotal.OppMonth
Results Grid
MonthlyOpportunityTotal.OppMonth MIN Aggregation
MonthlyOpportunityTotal.MonthlyTotal MIN Aggregation
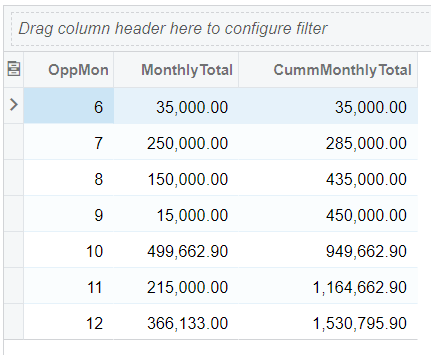
MonthlyOpportunityTotal2.MonthlyTotal SUM Aggregation
The results should look like the below:
Enter your E-mail address. We'll send you an e-mail with instructions to reset your password.


