Question

Project Monthly Analysis Report Total Column in ARM

  • 28 March 2024
  • 4 replies
  • 40 views

Userlevel 2
Badge

Hi Everyone,

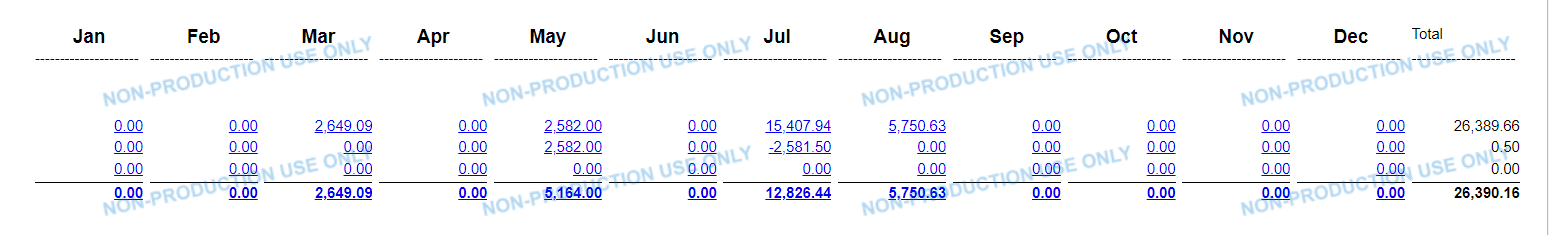
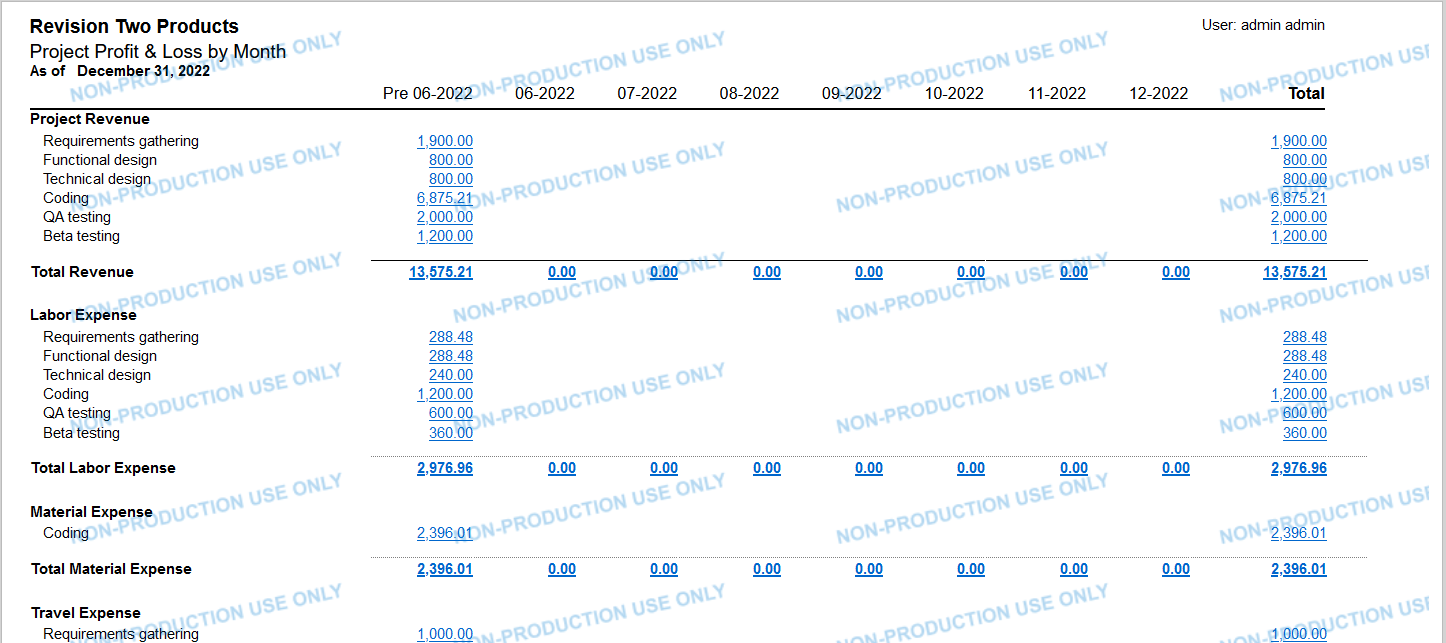
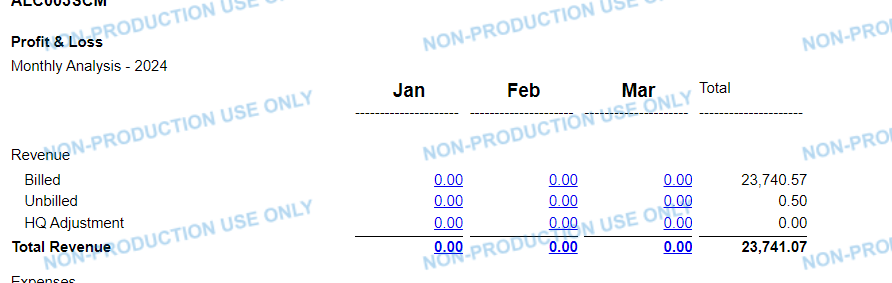
I am working on a P&L monthly analysis report for projects. but I am having trouble on how to configure the totals’ column, i.e. when I run the report for example for March. it will show columns of Jan and Feb with zero since there are no figures in those periods as you can see the screenshot, but in the totals’ column it will show the totals from all the other previous periods not just the ones in the report which is ideally supposed to be zero. If there is anyone who knows to solve this, please help out.

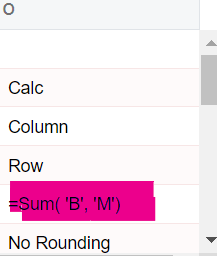
This is how it’s set it up in column sets.


4 replies

Badge +18

Hello,

In this example, which months or columns contain the figures that are adding to your total?

If you change the calculation Value to =B+C+D is the total correct? 

We may need to see a larger sample of the report column, to better answer. Thank you.


Laura

Userlevel 2
Badge

Hi @Laura02 

The totals you are seeing is the sum of all revenues that were earned in all the precious periods i.e. through 2023 up to the selected periods in the report and yes, I tried using =B+C+D….. but I was getting the same results, I have attached a excel of the column sets for more clarification, please ignore column N. and the highlighted column is the one am using for the totals.

And this is how the report looks when you run if for a whole year.


Badge +18

Hello,

Thank you for the extra detail!  It helps me to SEE details. 😃

It looks like 12 previous periods are included in the report.  The Data source has -1, -2, -3 and so on to month -11.  It seems like the user may choose both a From and a To period, correct?


Each previous month has a visibility formula which i understand allows the user to select certain months.

However the Total column has no visibility formula, meaning the calculation =sum(‘B’,’M’), I expect will add up all the columns B to M whether they are visible or not.

It is much easier to show something like “12 Months Rolling” with all 12 months of the year visible (no choice of From and To for users), with one Total for all 12 rolling months, than to ask the user to choose any group of months (any From-To combination) and have one total column that adjusts based on all potential column combinations.  I think the “If statement” required to consider all From/To combinations that a User may make will be larger than the Visibility formula window will hold.

You may need 12 Total columns with similar Visibility formulas, to make the Total column add correctly.

If I am not understanding, then I’d like you to explain the Visibility formula:

=IIf(Right(Format('{0:MMM yyyy}',DateAdd(CDate(Left(@StartPeriod,2)+'/1/'+Right(@StartPeriod,4)),'m',-2)),4) = CInt(Right(@StartPeriod,4)), True, False)


Best regards,


Laura


Userlevel 2
Badge

Hi @Laura02 

We borrowed the concept from the Project Profit and Loss by month and 12 roll for GL type in the sales demo, but the user had a unique requirement whereby if they to run the report. for the whole year .i.e. if Dec 2023 selected in the financial period parameter (and by in the parameters we required the user to the “period to” only) the report returns all months for 2023(Jan - Dec) with each month its own amount turnover but if they are to select maybe March 2023 which is not a yet full year, the report returns only the two previous period of that year and the specified period in the parameter (Jan, Feb, March $ the totals of only these 3) that’s where the visible formula comes in to take care of that.

About the visible formula

Forexample we used =Left(Format('{0:MMM yyyy}',DateAdd(CDate(Left(@StartPeriod,2)+'/1/'+Right(@StartPeriod,4)),'m',-11)),3) to define the Title of the column with data source -11 in order to display it like Jan this was done for all the columns until the one that has DataSource 0 then used =IIf(Right(Format('{0:MMM yyyy}',DateAdd(CDate(Left(@StartPeriod,2)+'/1/'+Right(@StartPeriod,4)),'m',-11)),4) = CInt(Right(@StartPeriod,4)), True, False) for the visibility of the column considering the user’s requirement I mentioned.

This is what the sales demo has but clearly it wasn’t fitting the user’s requirement hence these unfriendly formulas😥  


The attached is what we used for the header part of the report


Reply


About Acumatica ERP system
Acumatica Cloud ERP provides the best business management solution for transforming your company to thrive in the new digital economy. Built on a future-proof platform with open architecture for rapid integrations, scalability, and ease of use, Acumatica delivers unparalleled value to small and midmarket organizations. Connected Business. Delivered.
© 2008 — 2024  Acumatica, Inc. All rights reserved