Solved

How to display in report

  • 8 November 2023
  • 9 replies
  • 97 views

Userlevel 6
Badge +3

hello community,
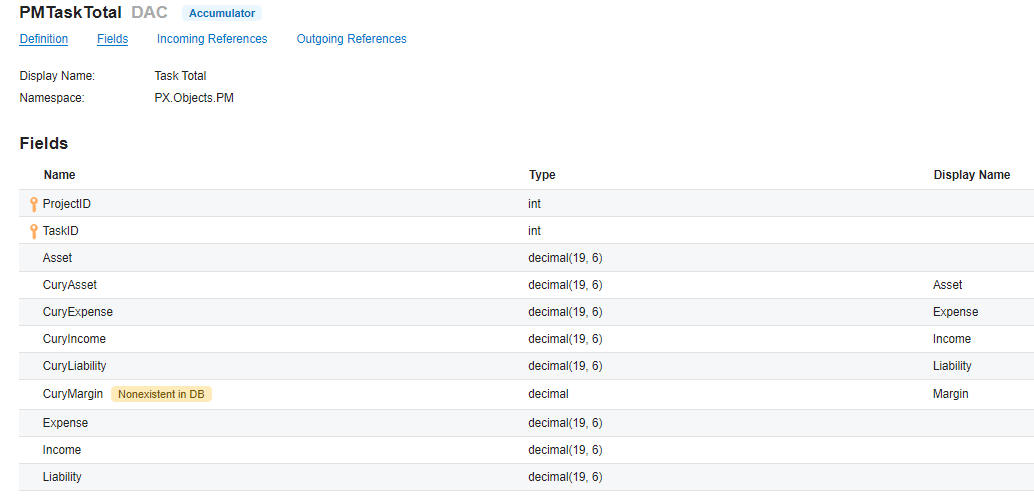
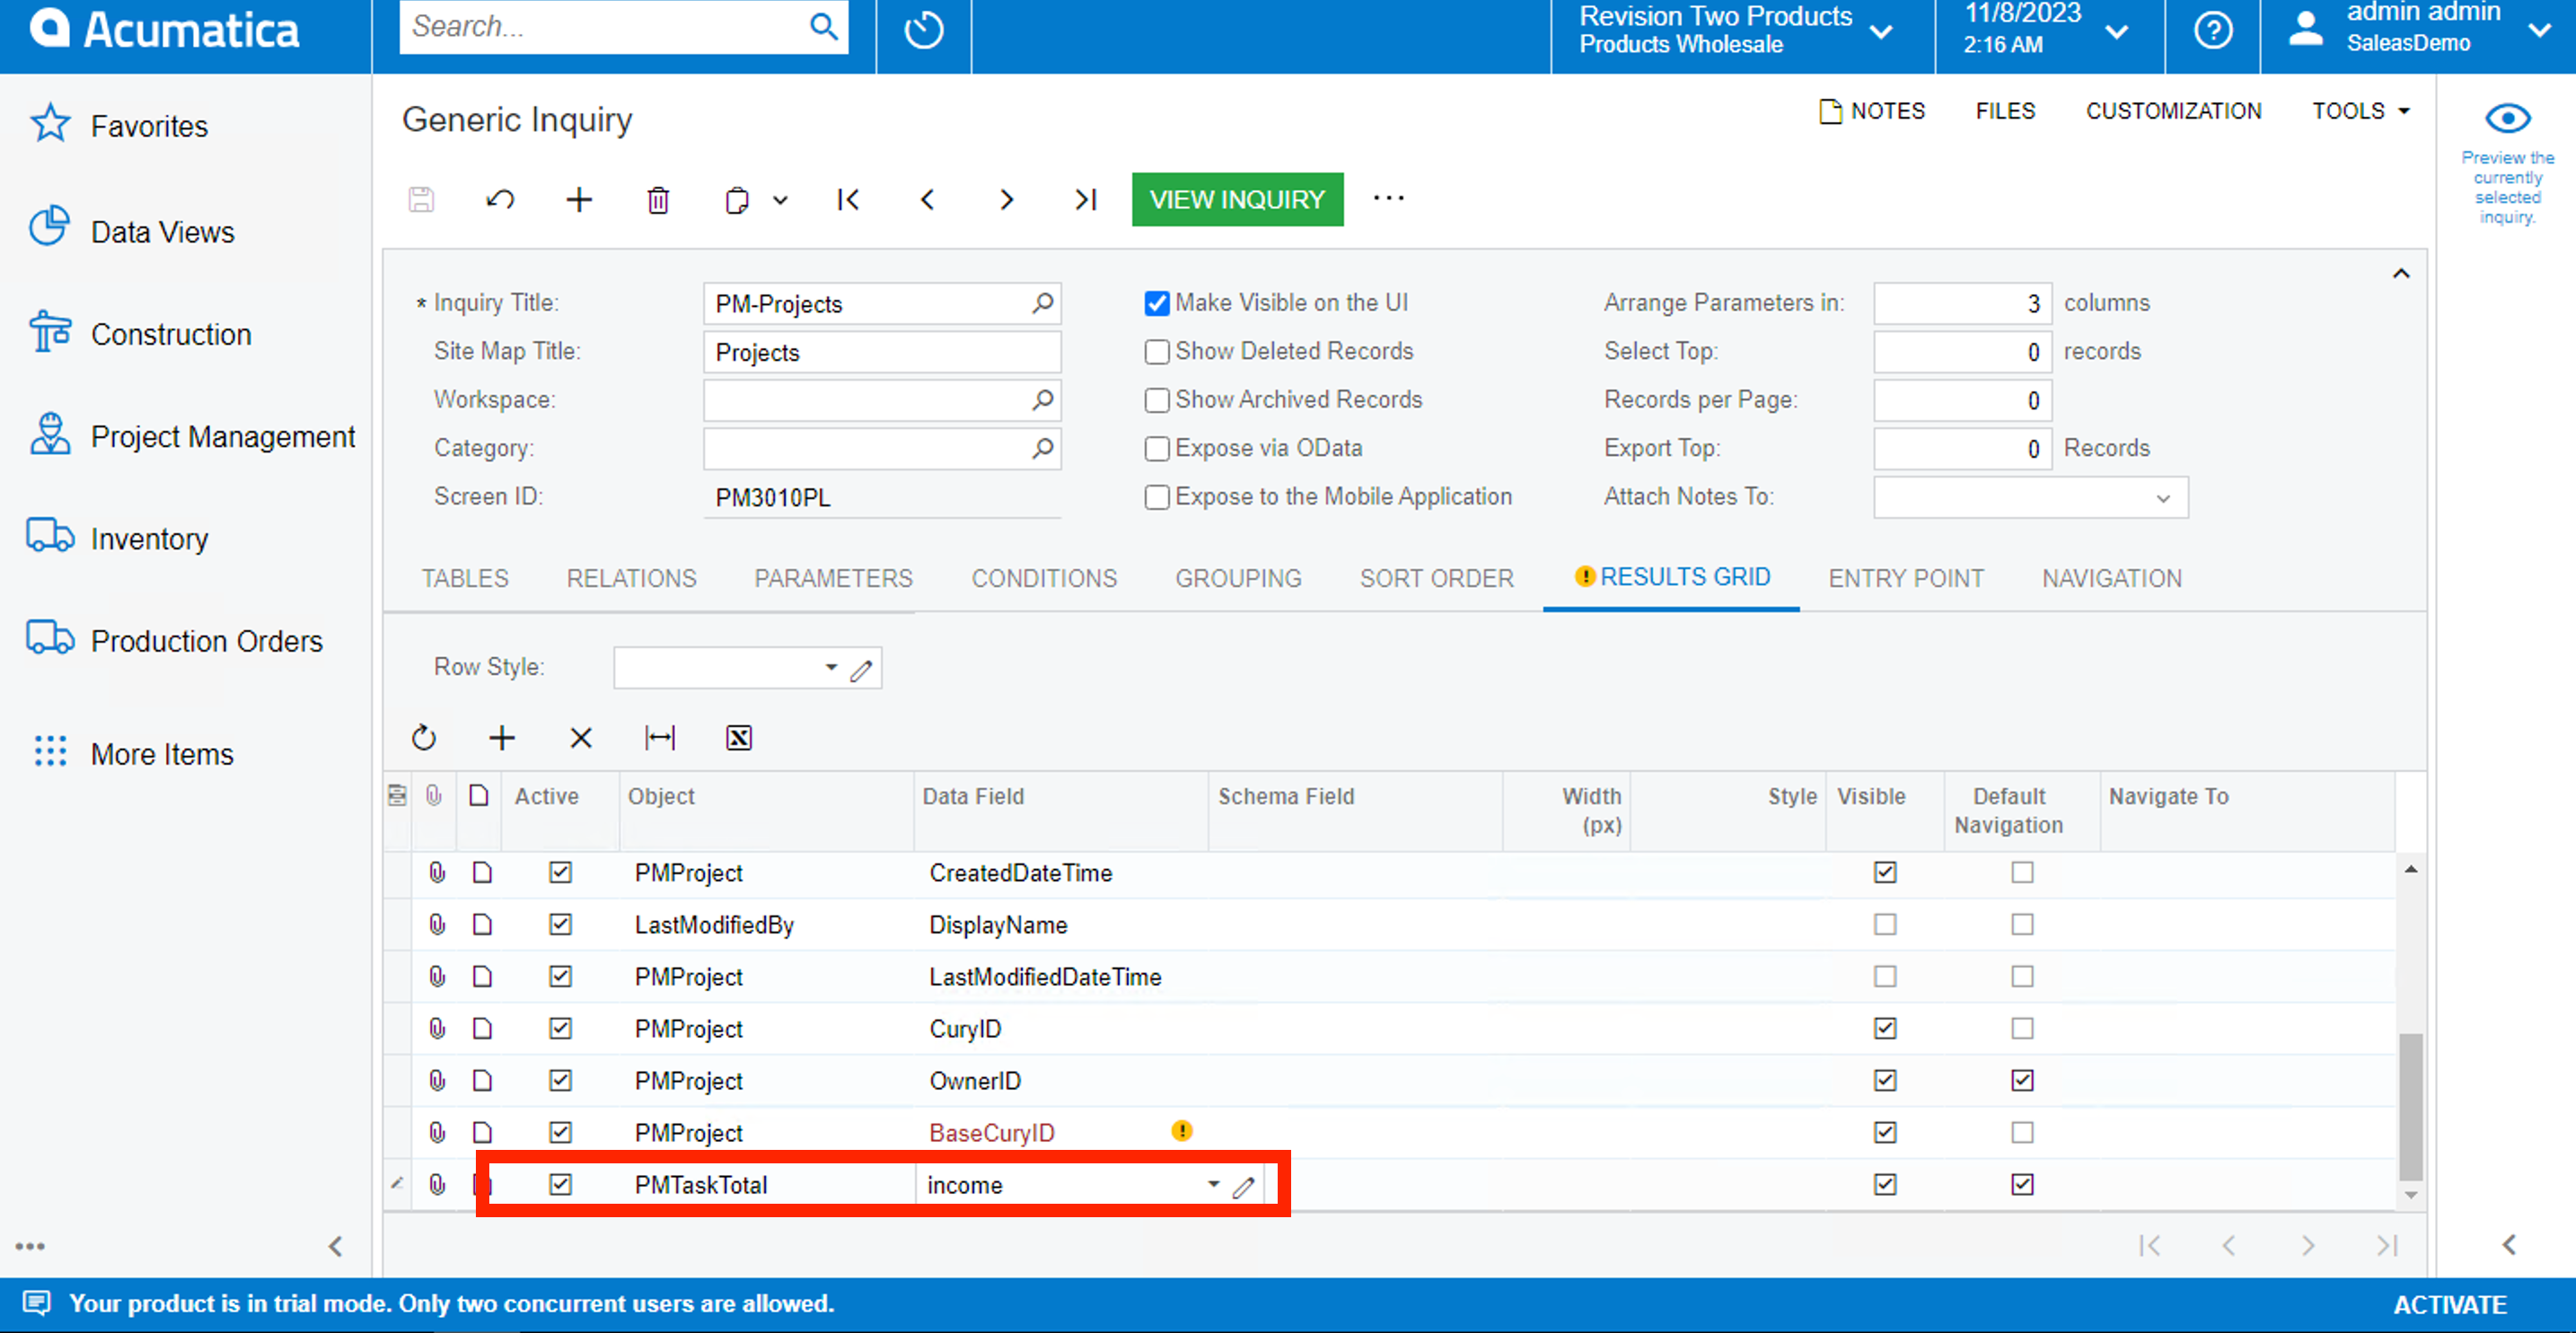
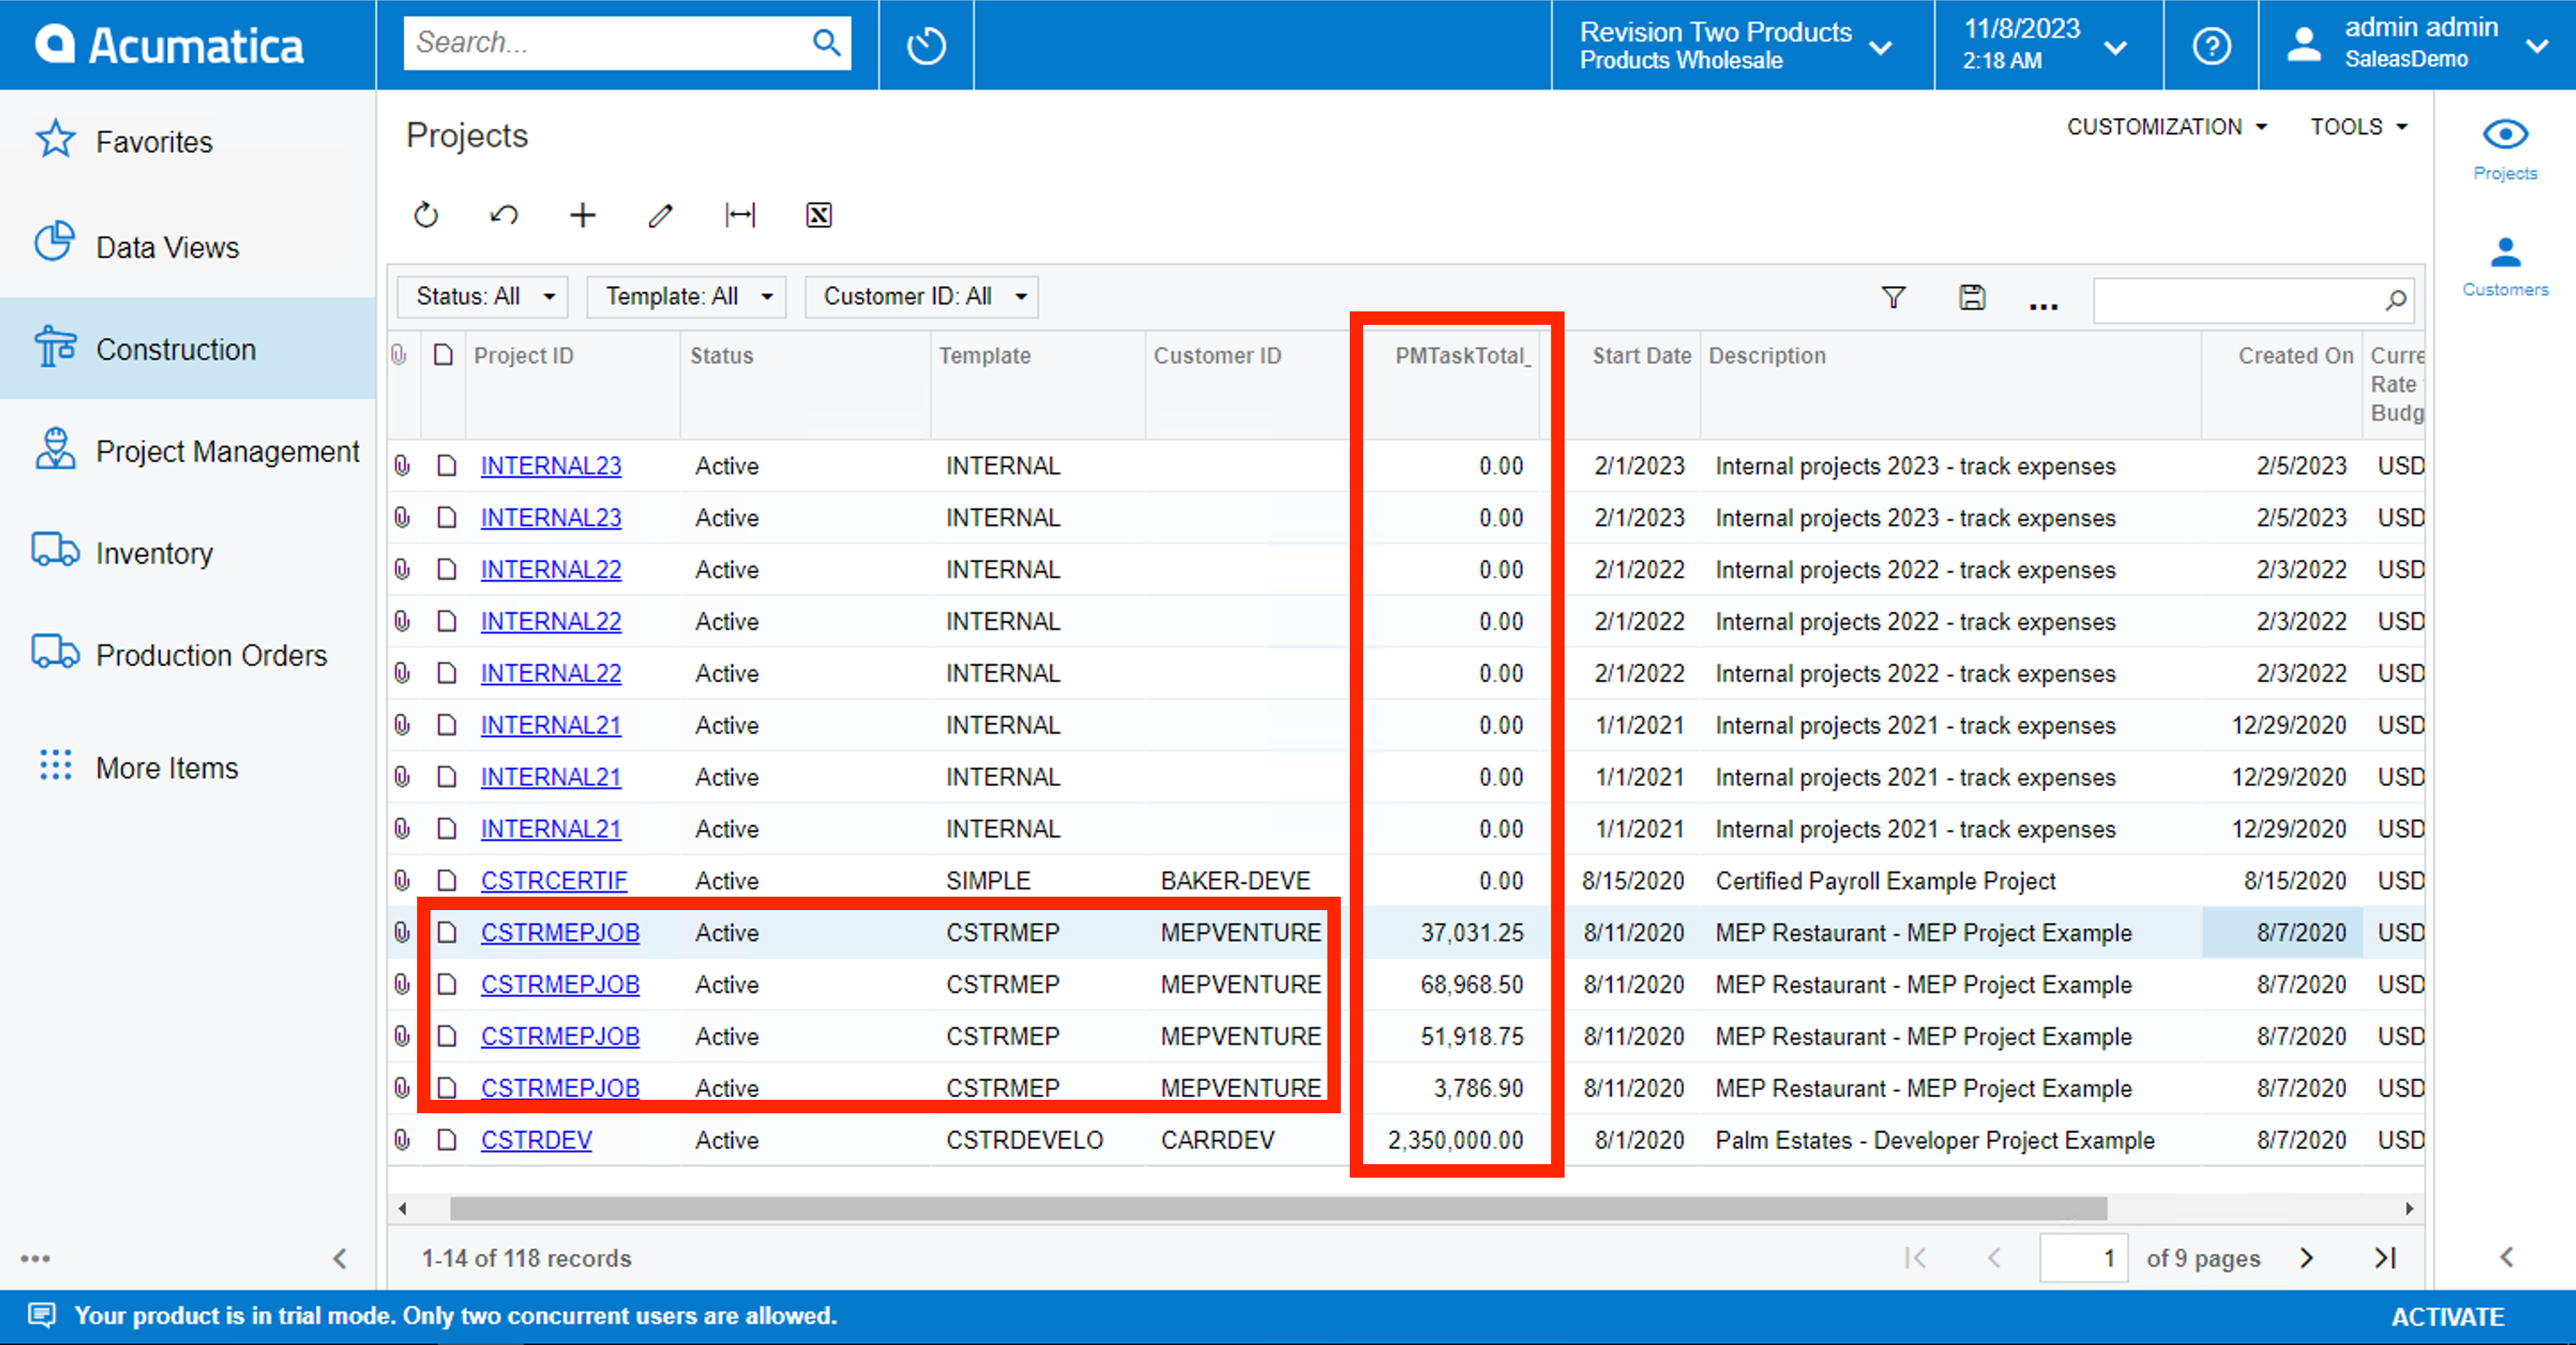
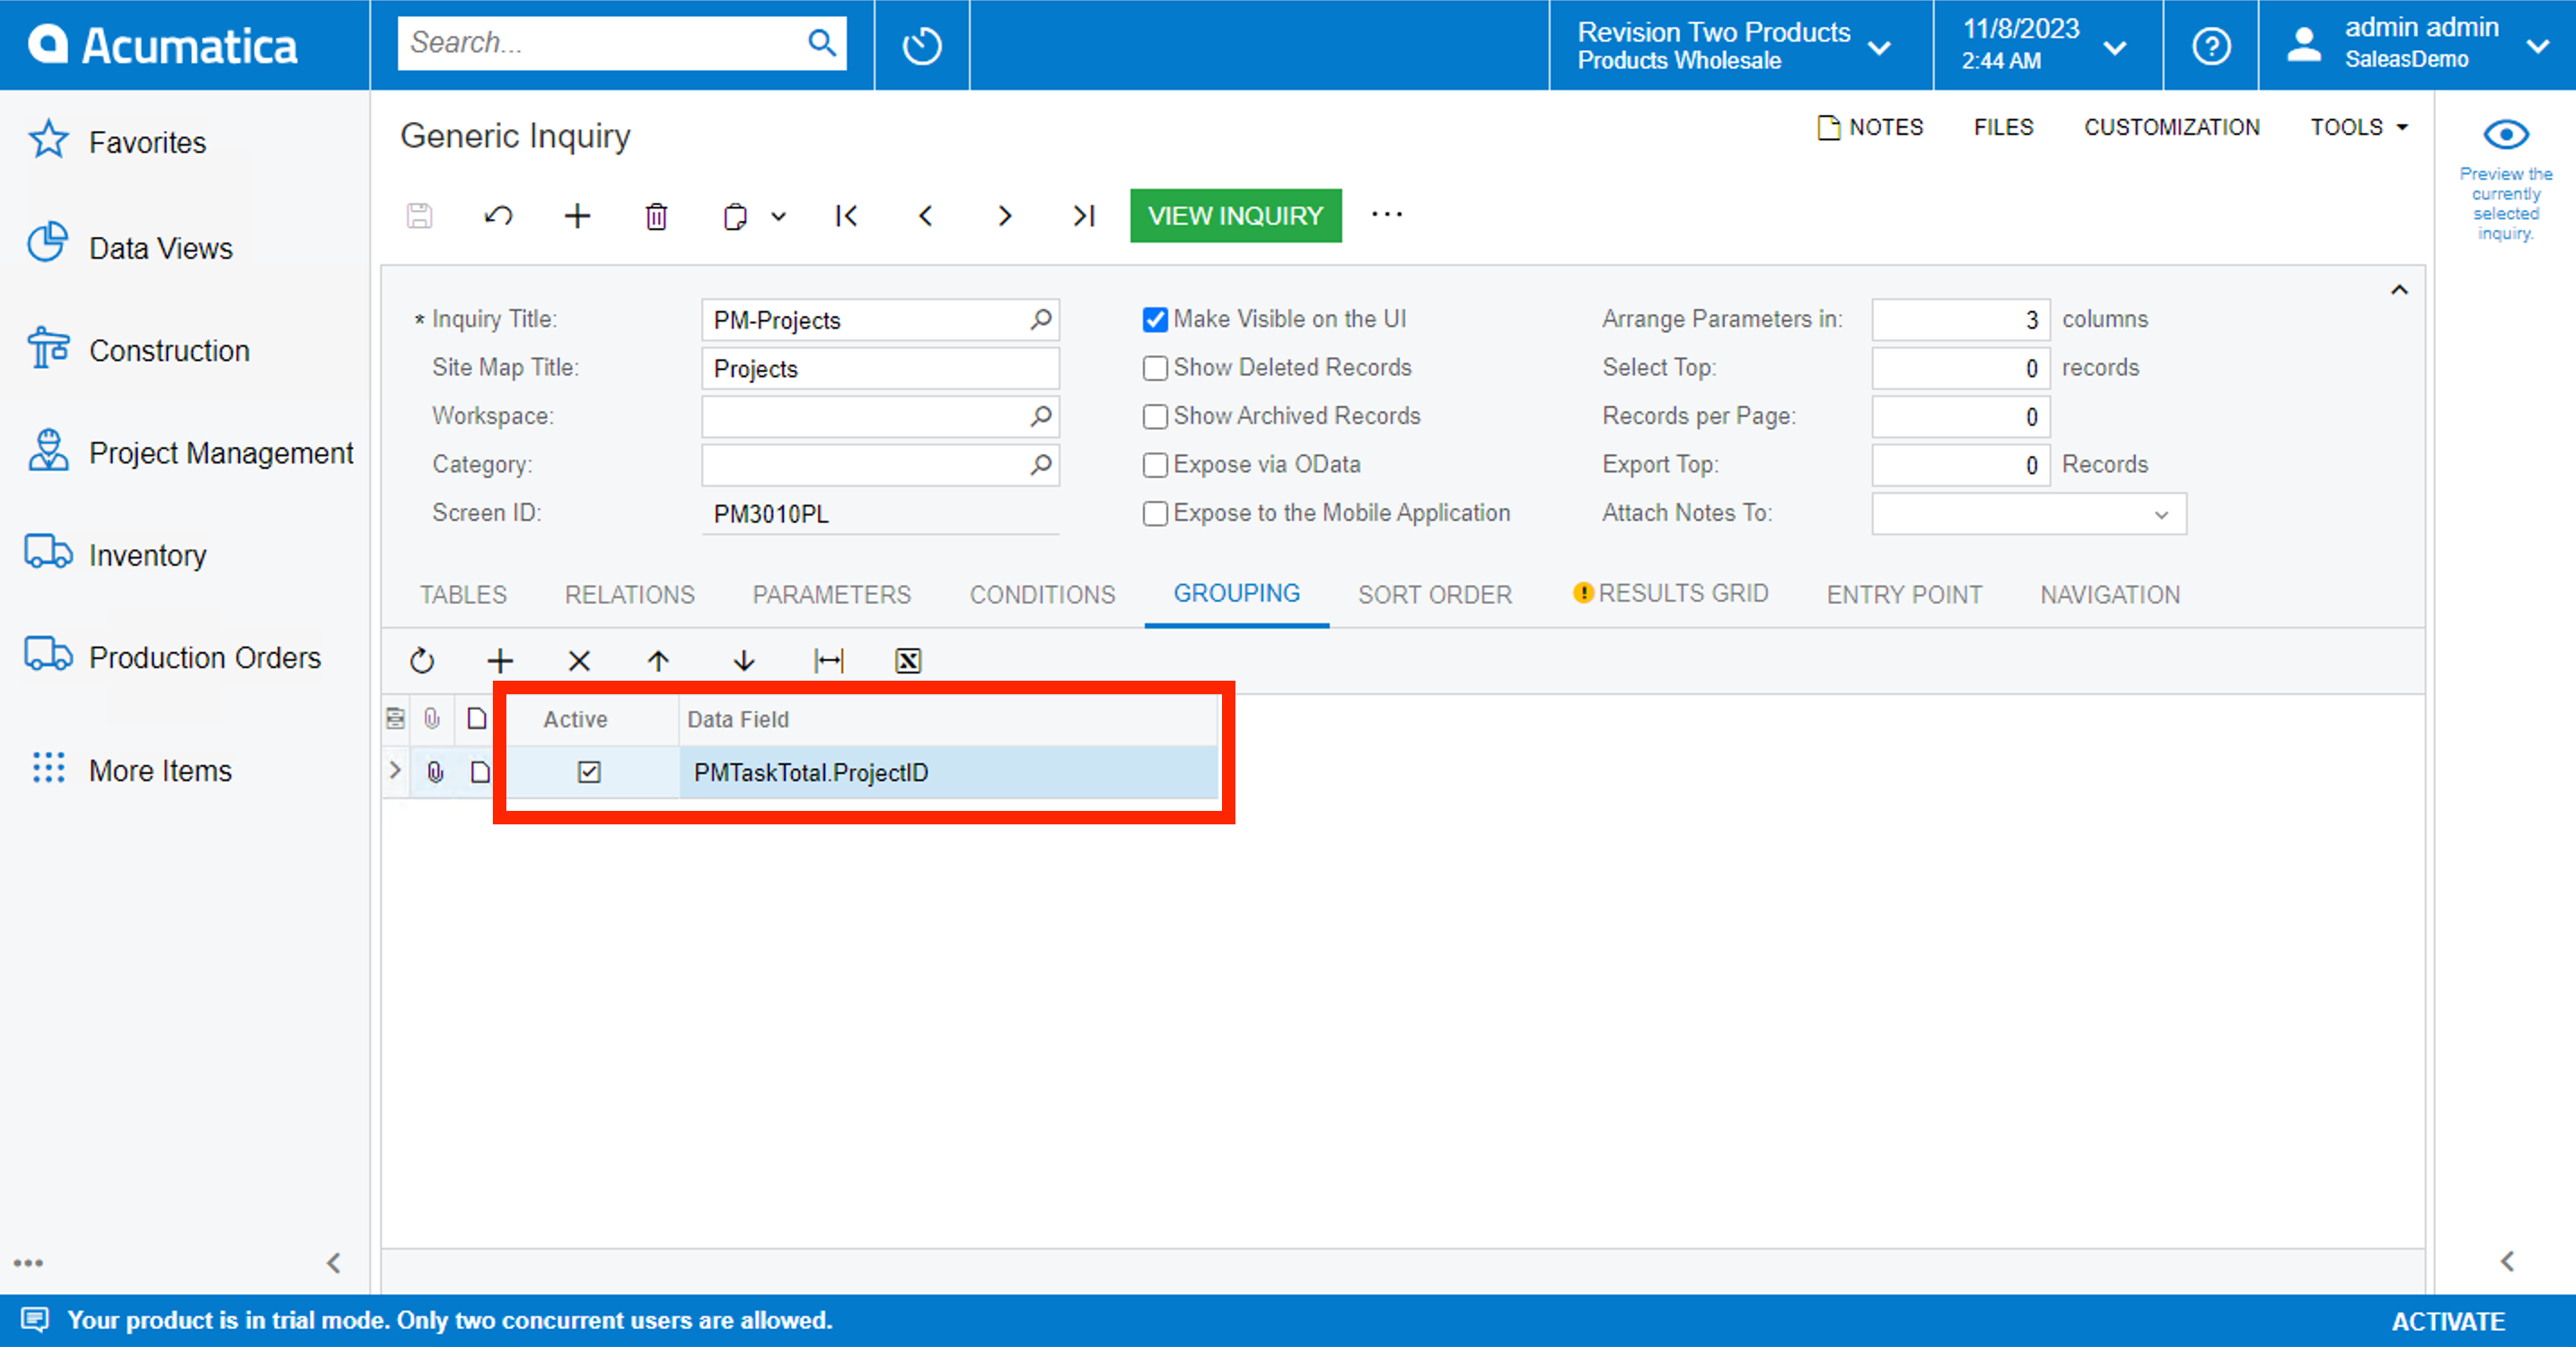
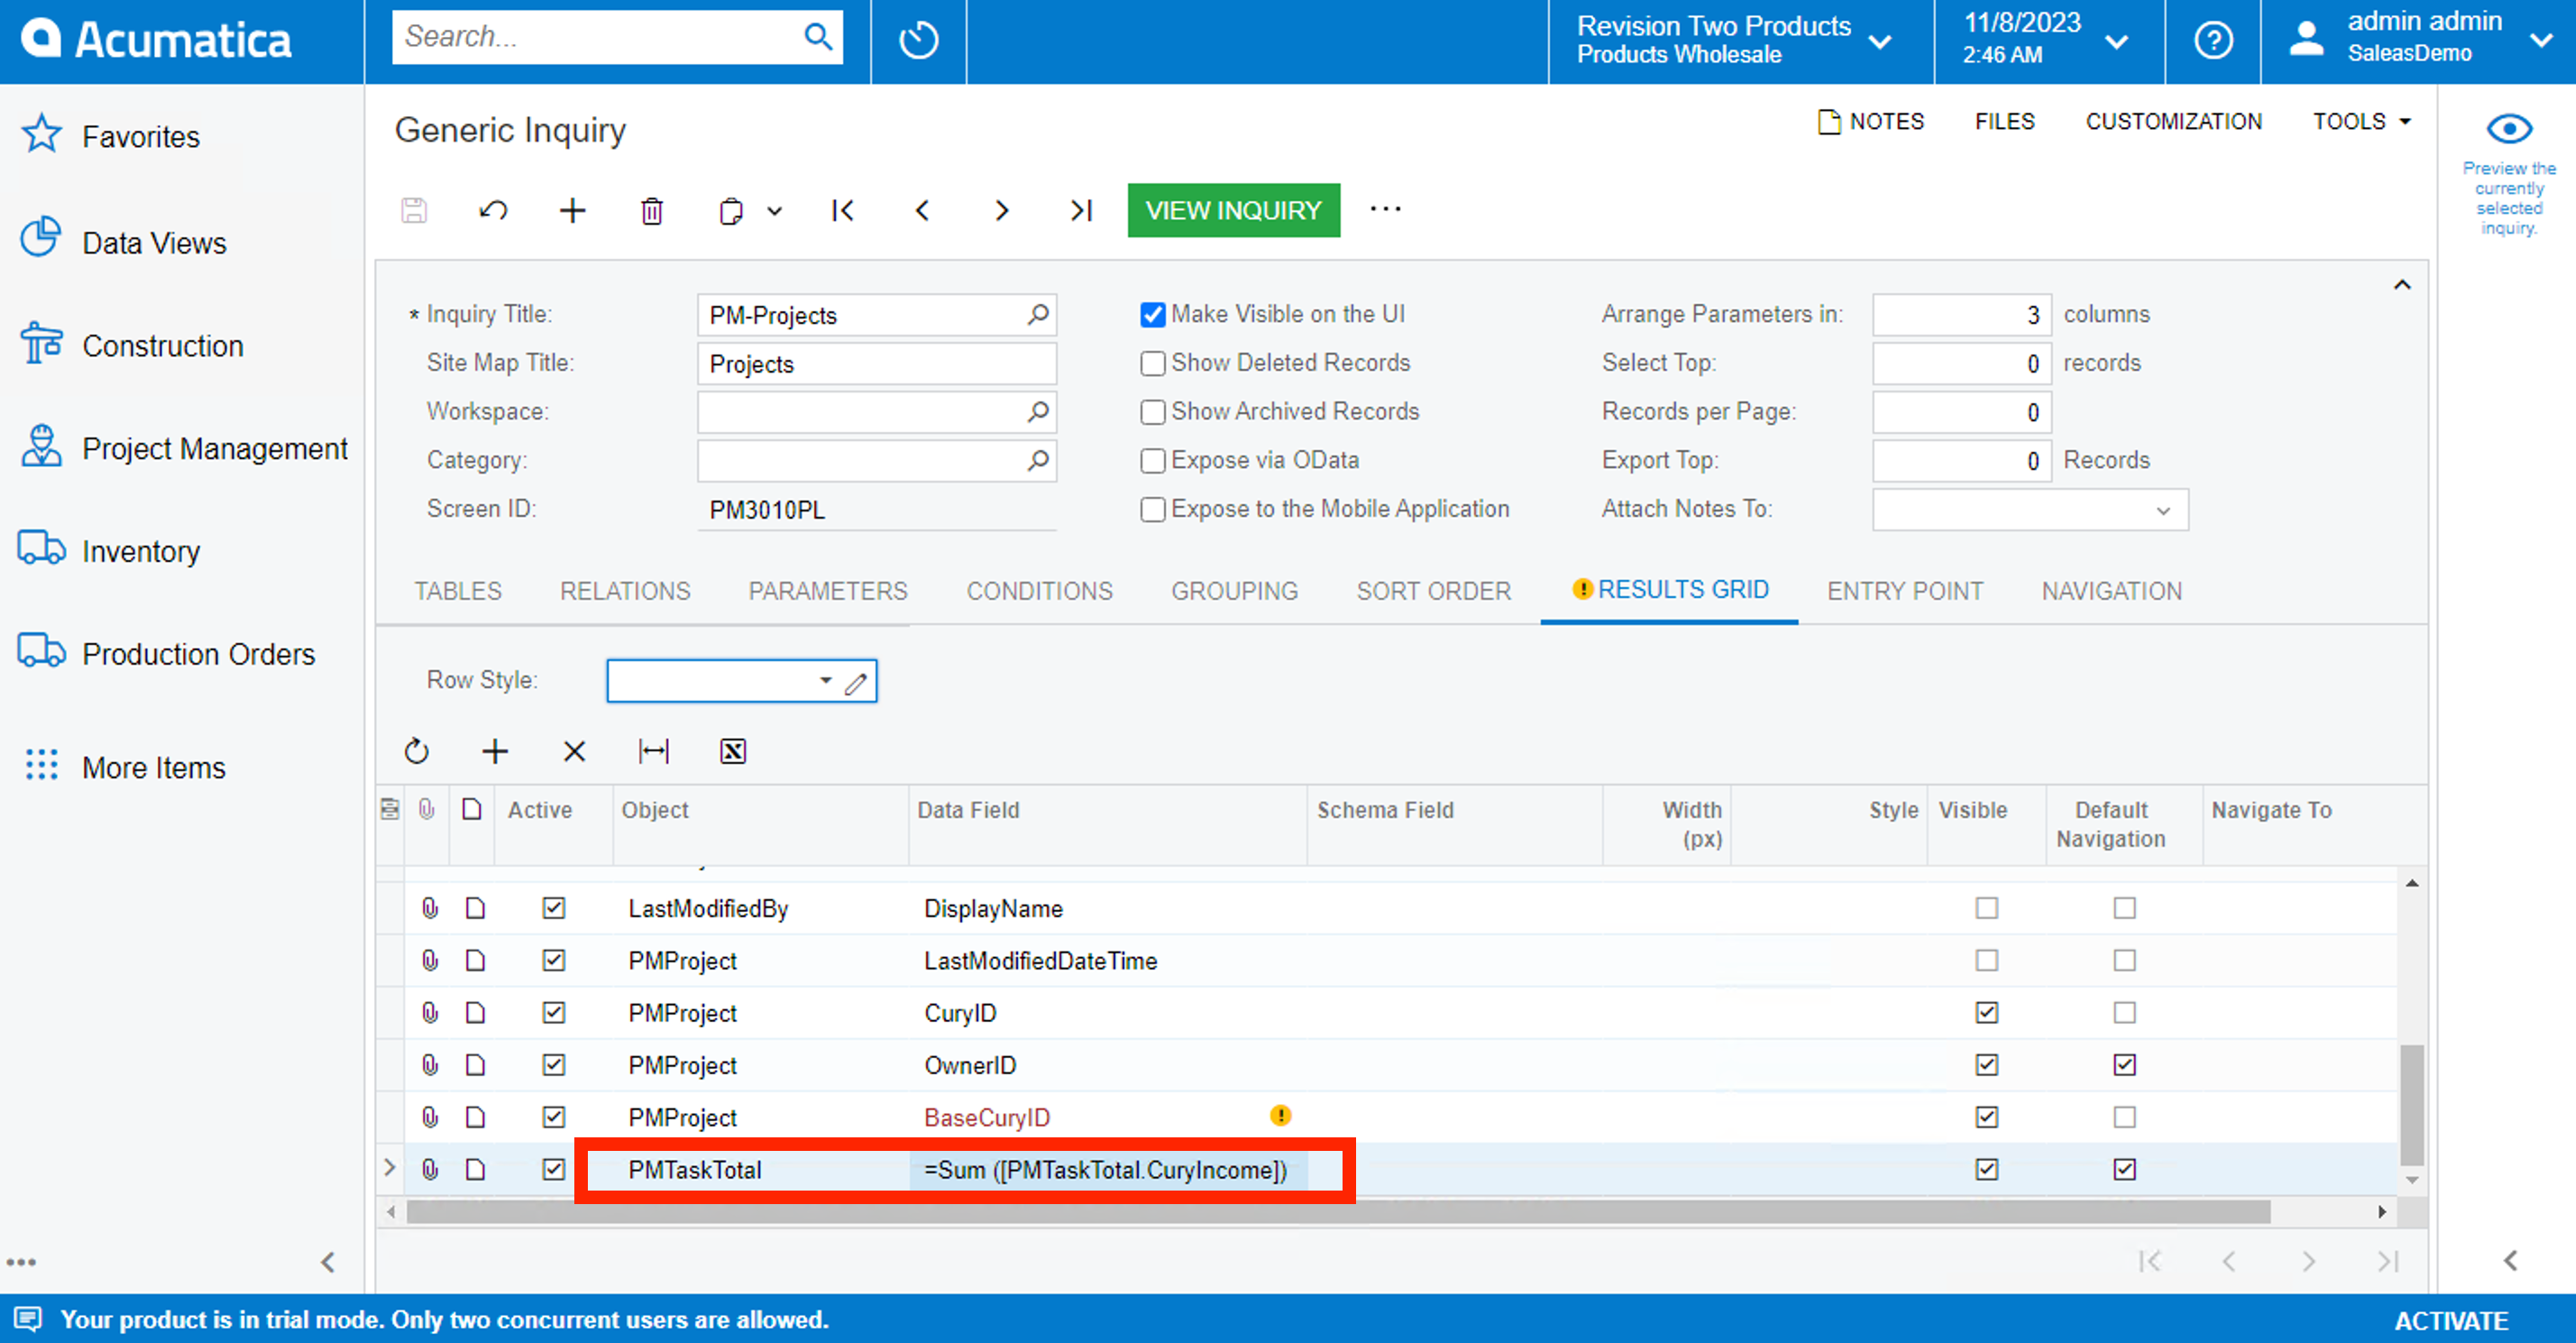
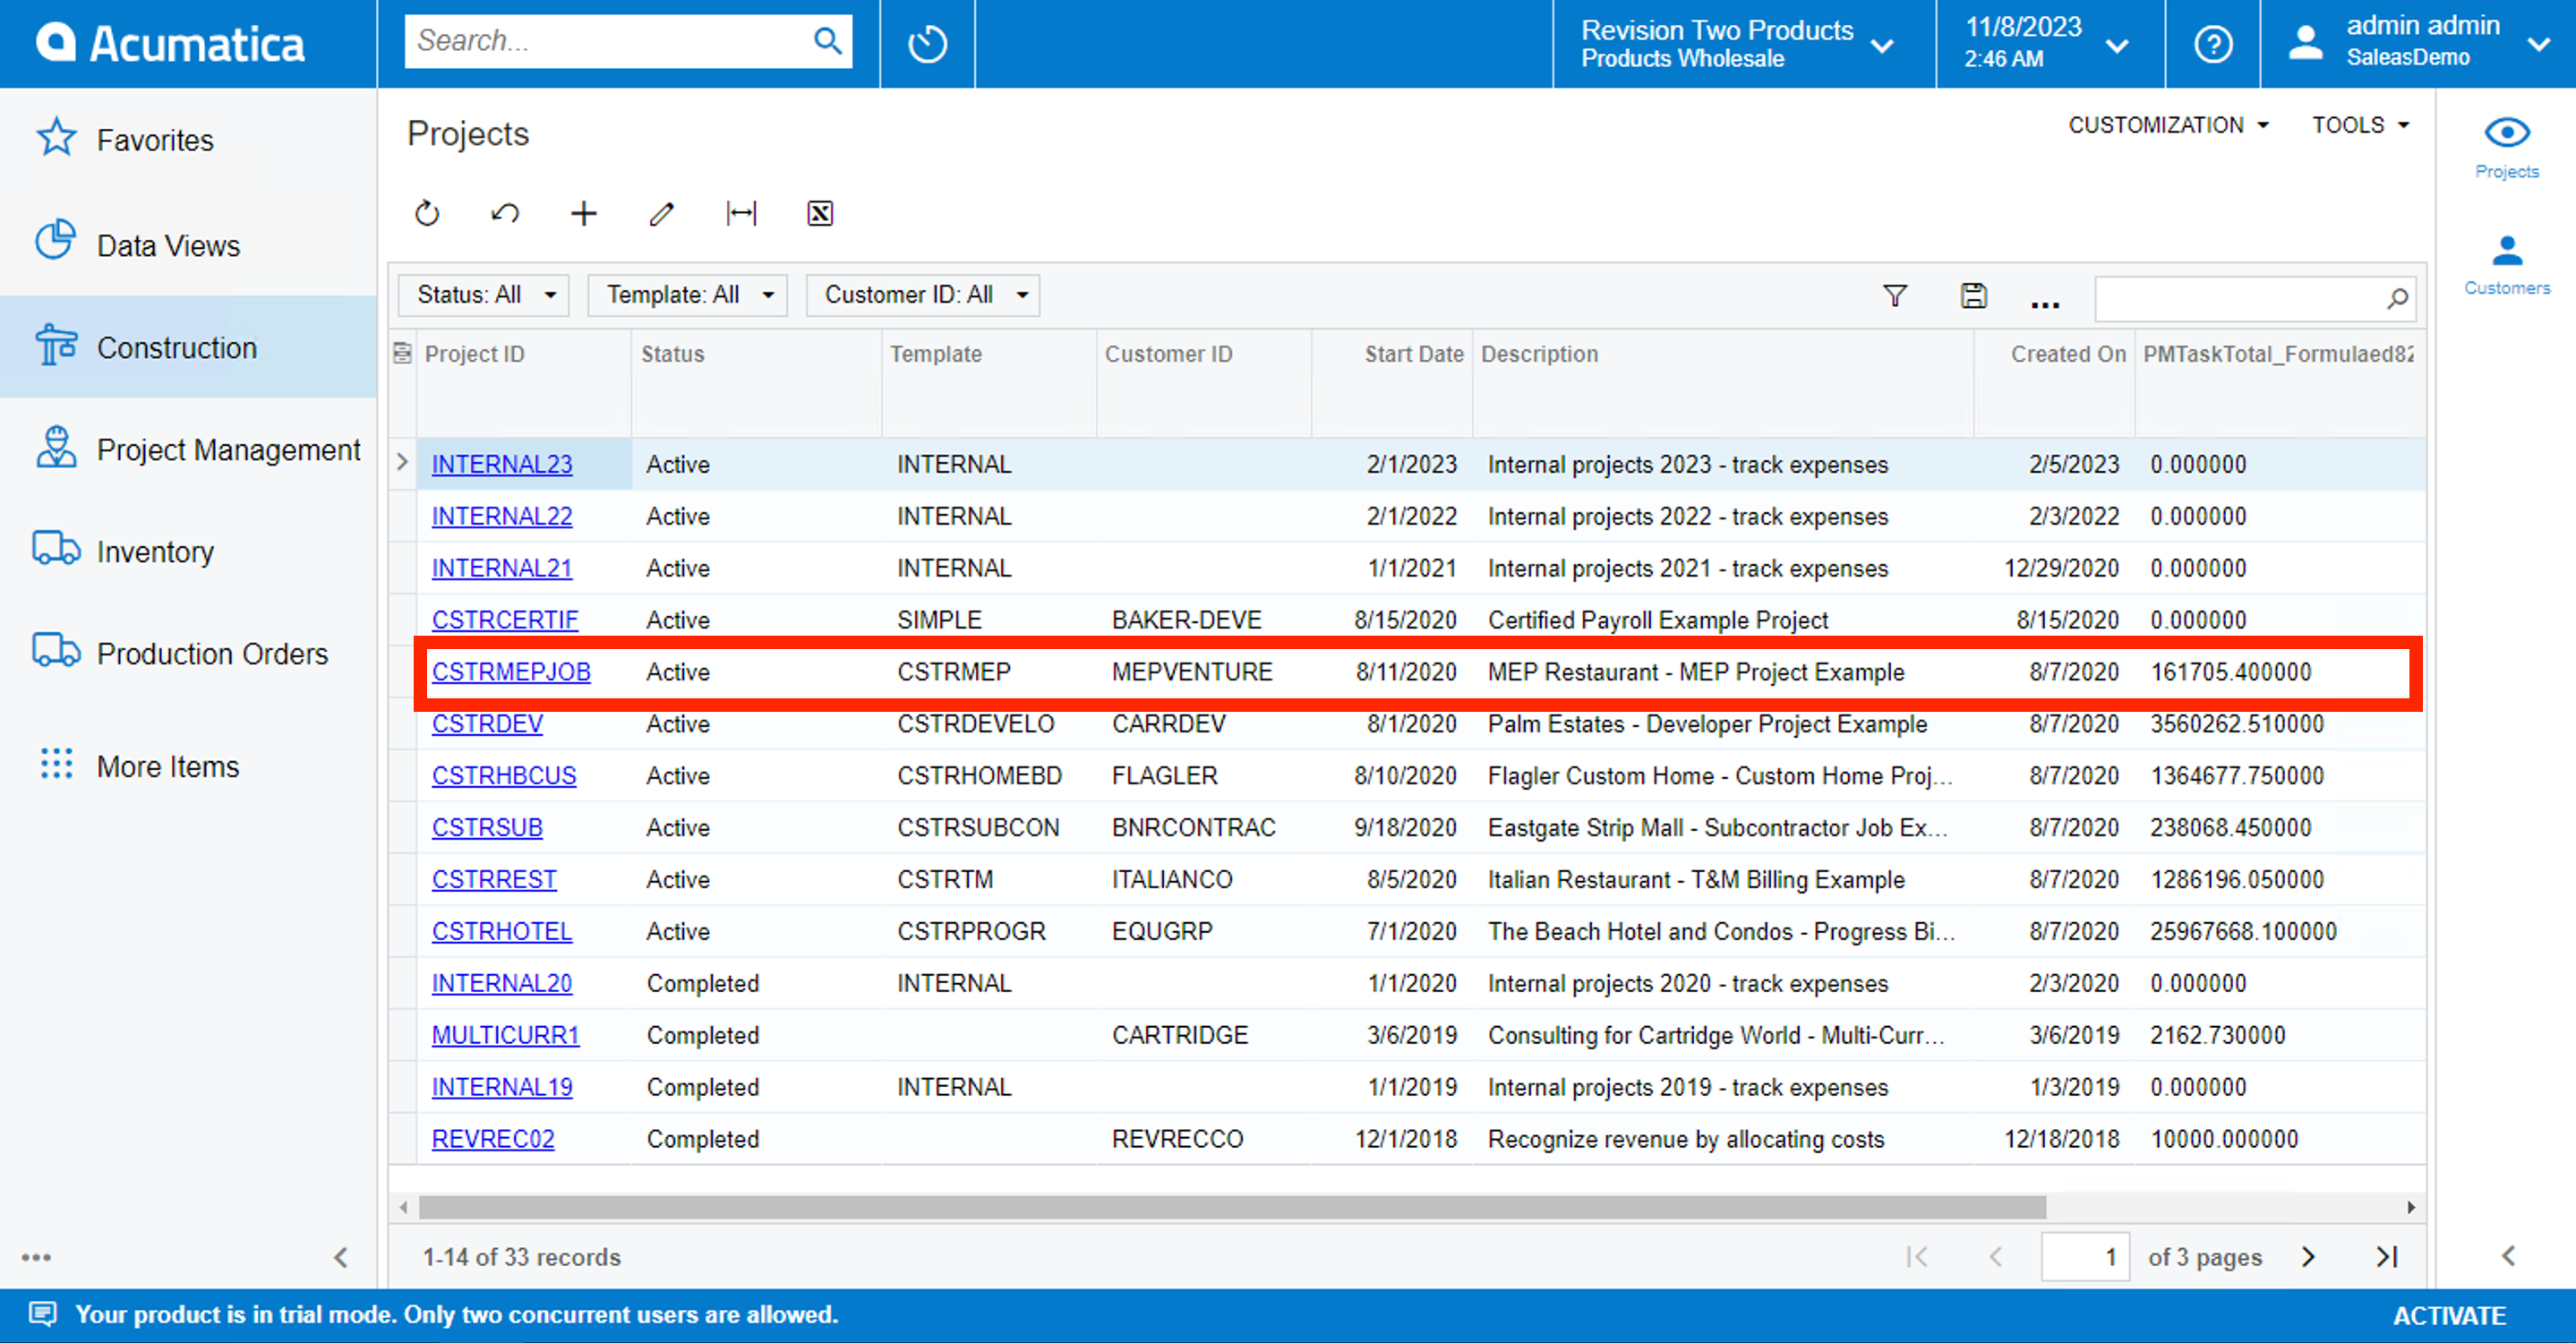
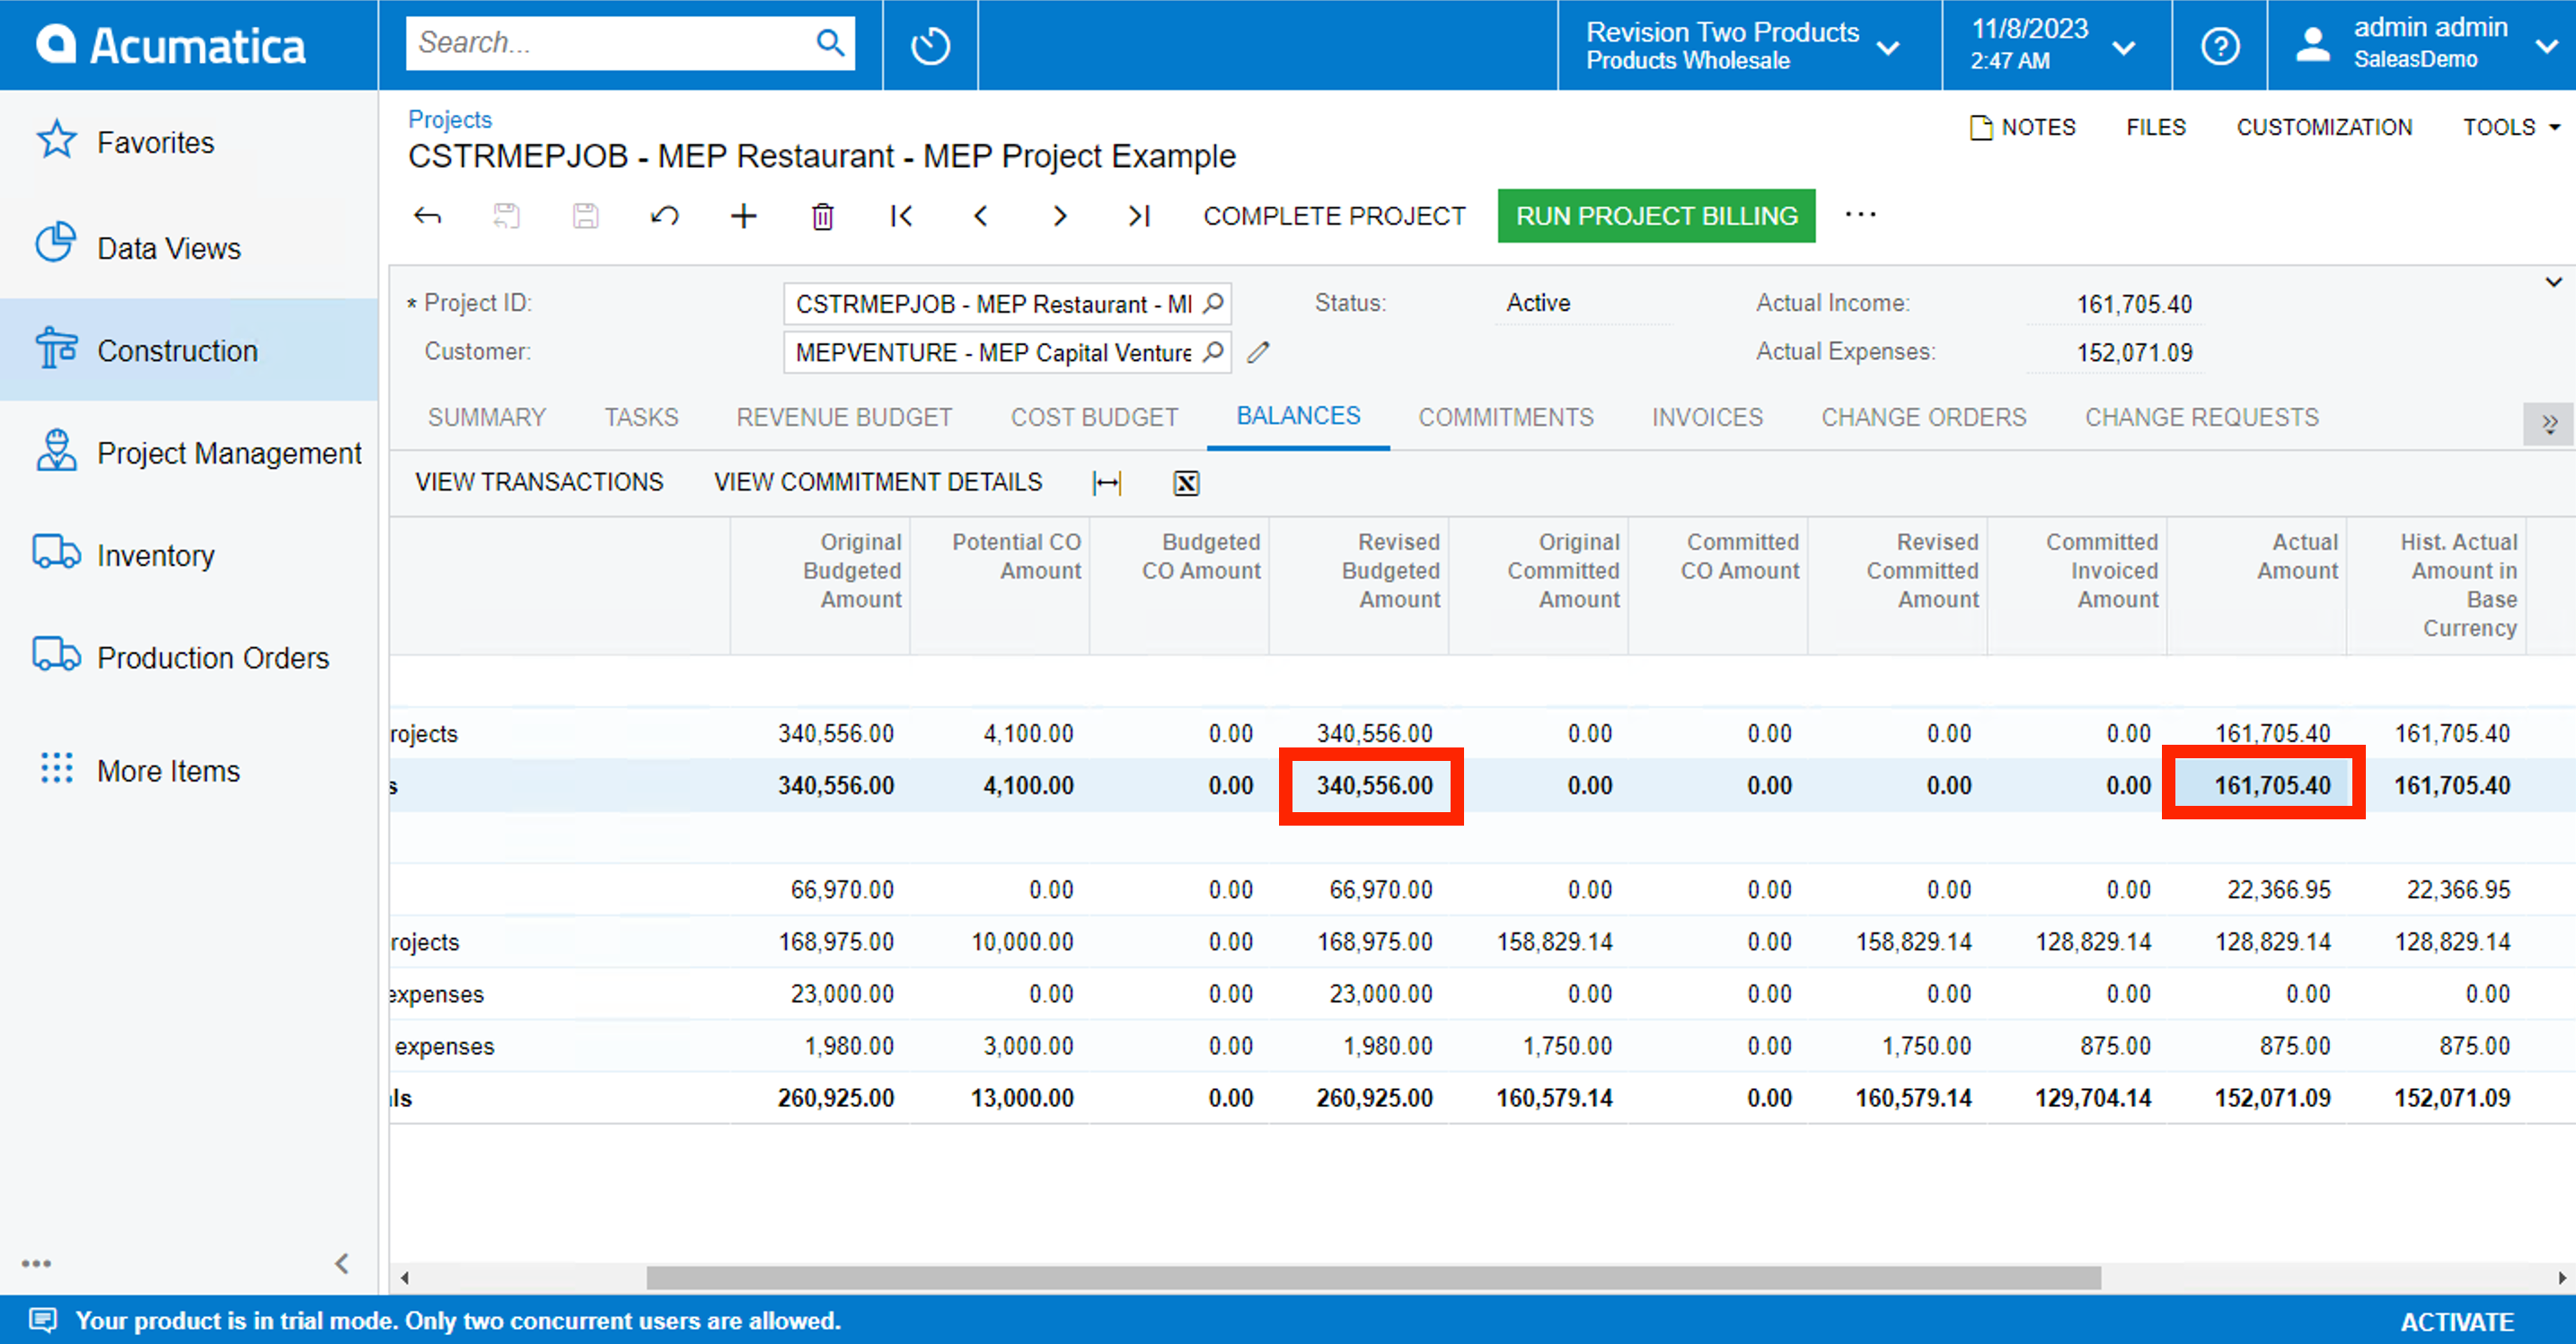
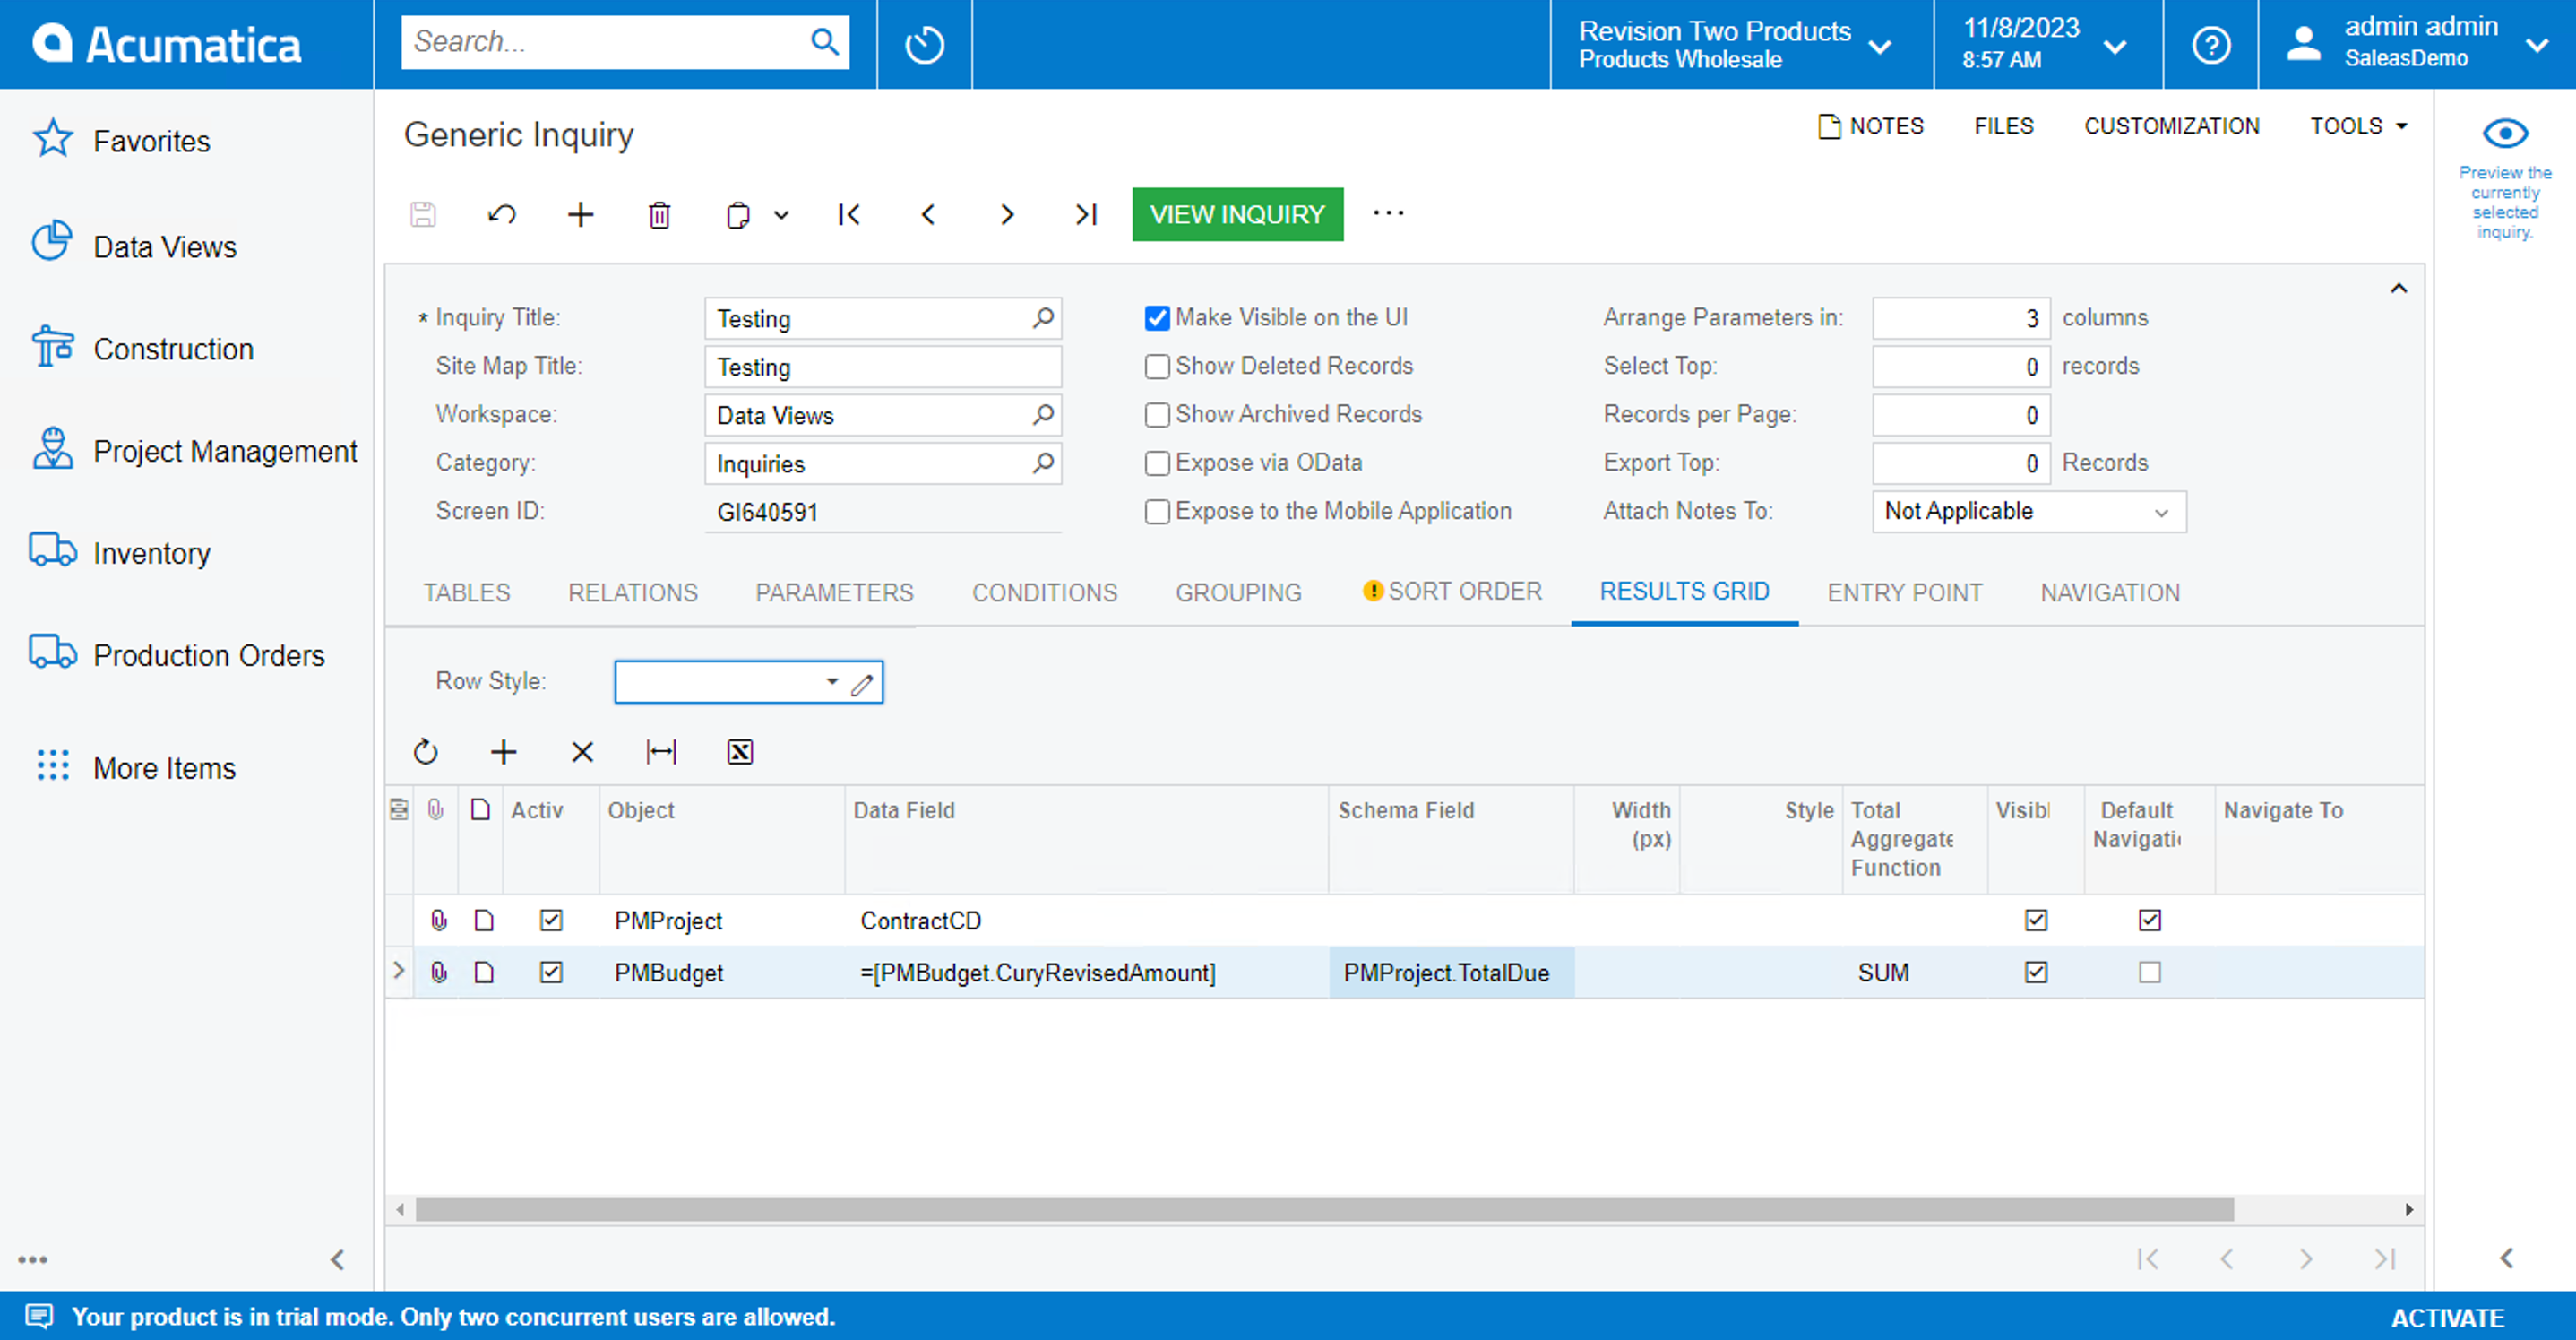
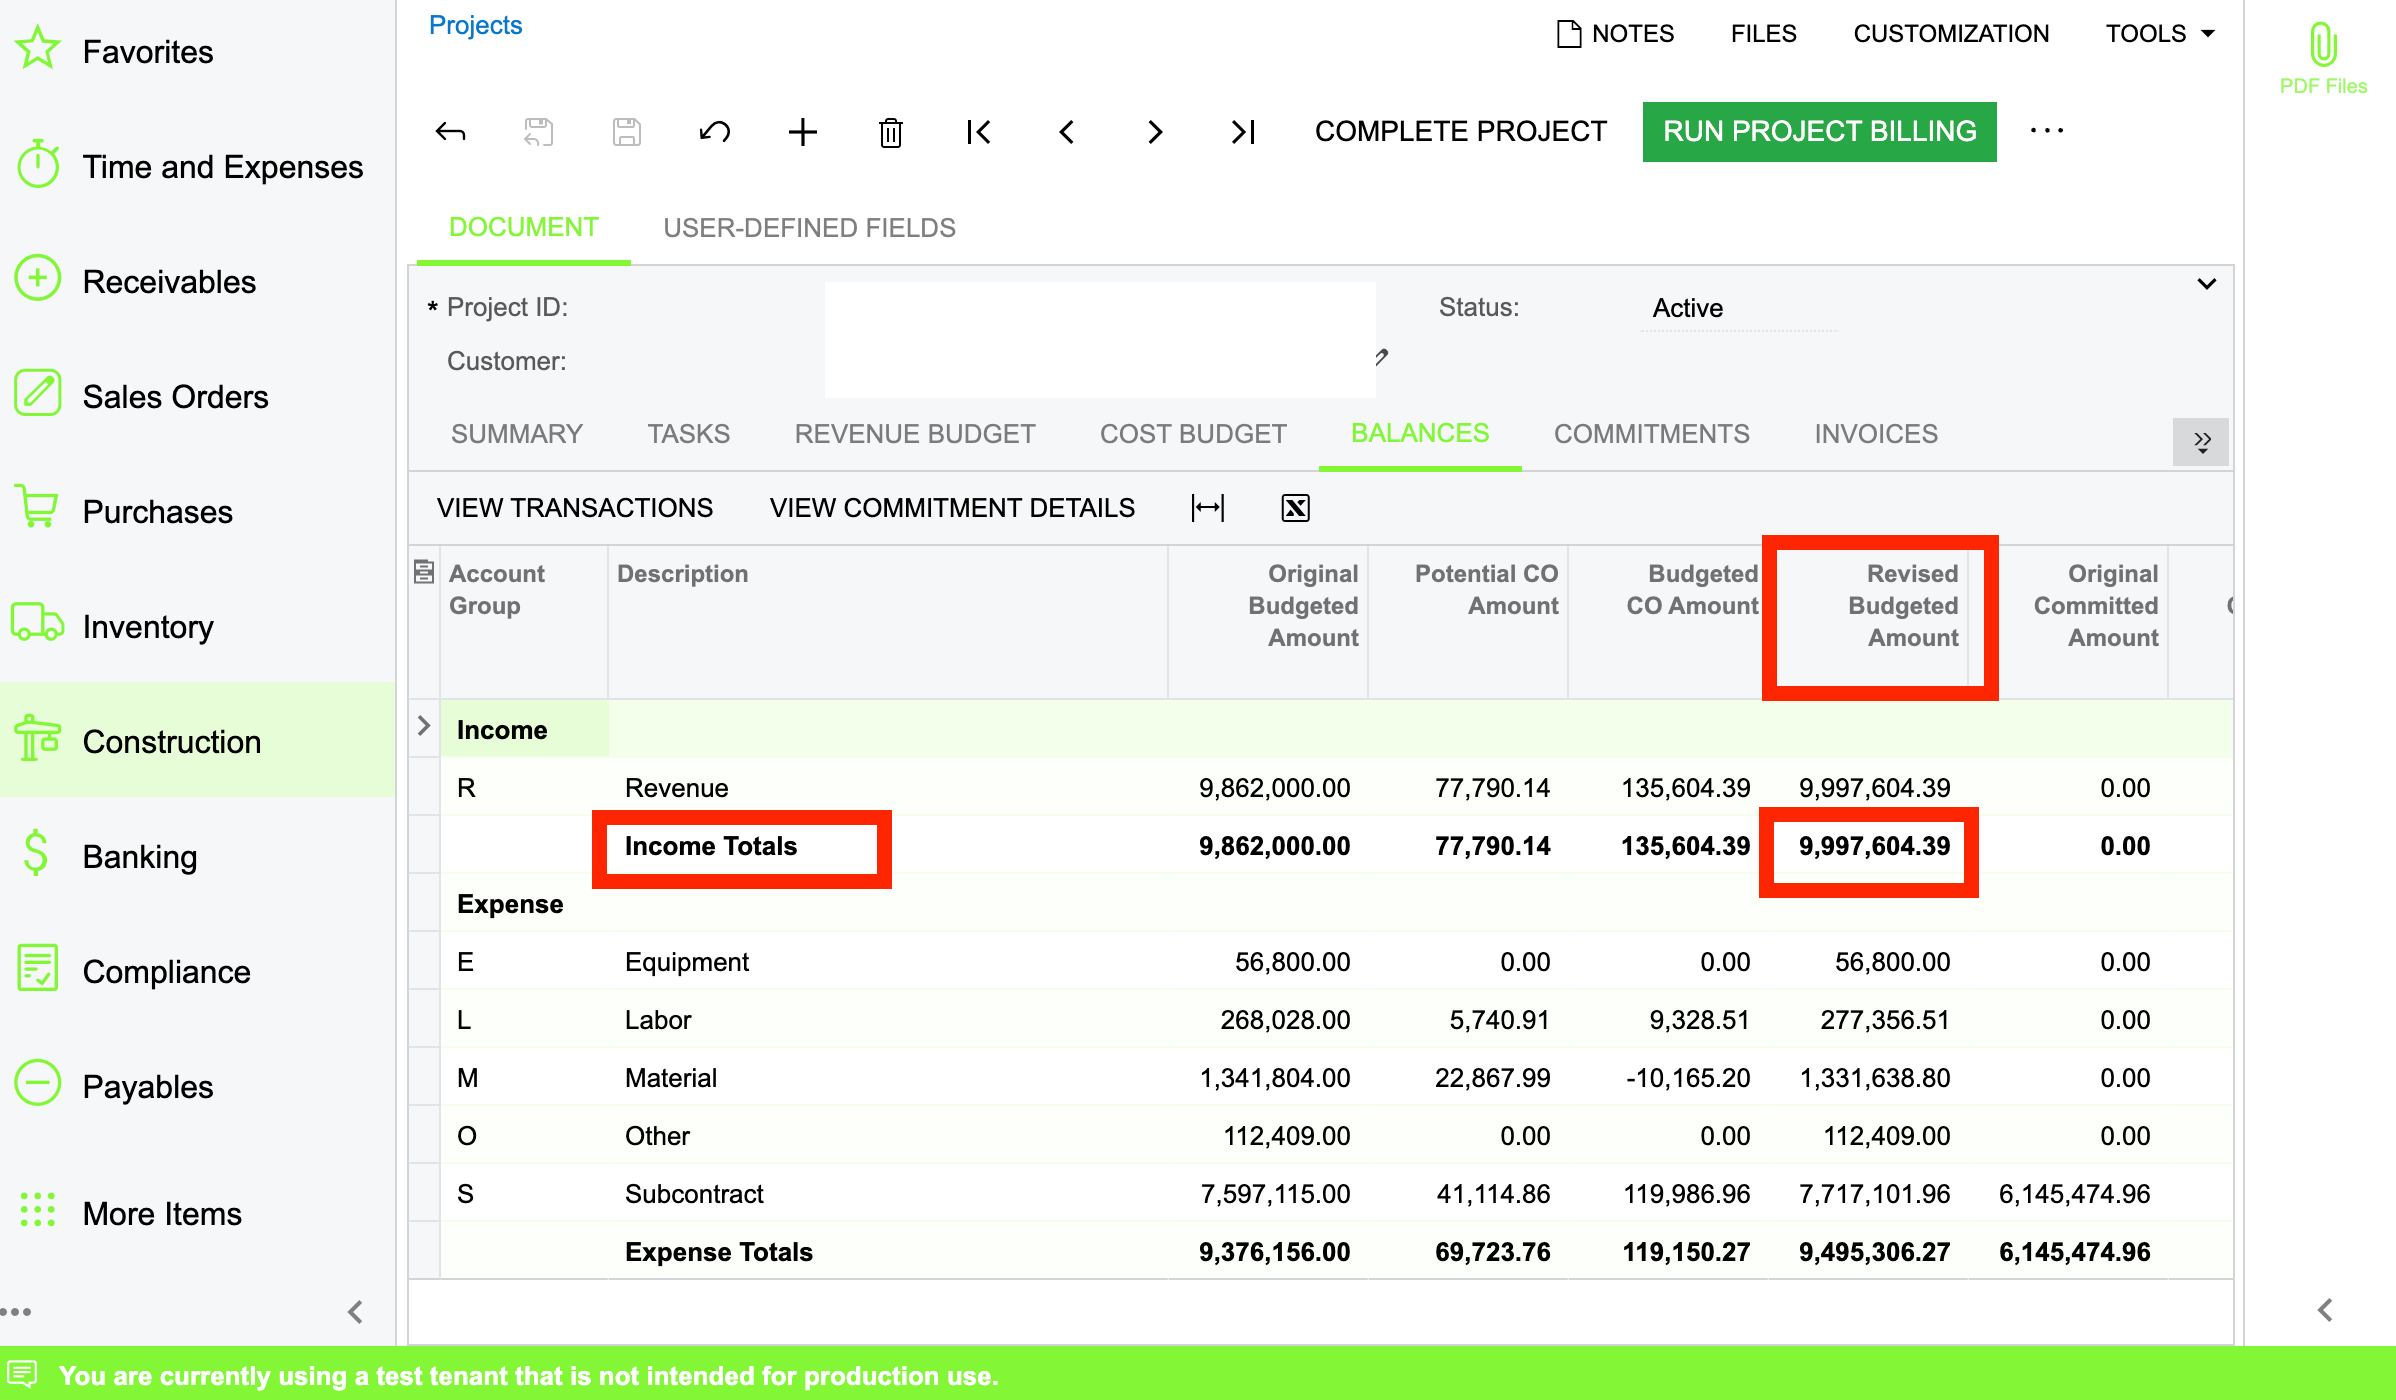
How can i display the below highlighted fields in a report?
As  “Income Totals: 9,997,604.39


icon

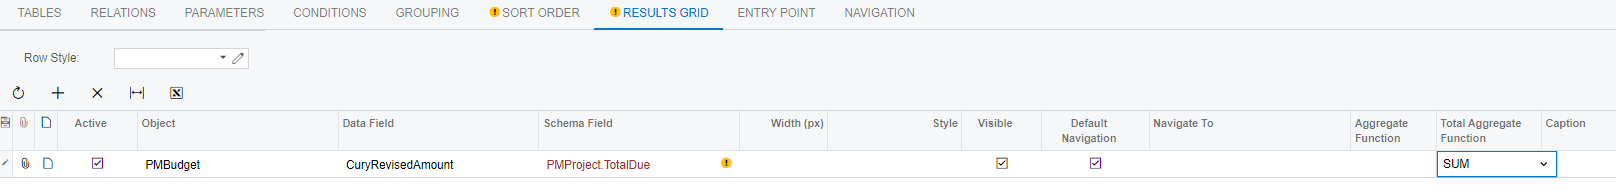
Best answer by dcomerford 8 November 2023, 18:43

View original

9 replies

Userlevel 7
Badge +12

They are not stored in the database so you cannot print them on a report. Look at the PMTaskTotal tables this should give you what you want as it holds a Total Income and Expense per task and project. You can group by Project to get a project total on a GI/Report


Userlevel 6
Badge +3

They are not stored in the database so you cannot print them on a report. Look at the PMTaskTotal tables this should give you what you want as it holds a Total Income and Expense per task and project. You can group by Project to get a project total on a GI/Report


Hello @dcomerford ,
thank you for your prompt response.
So I joined the PMProject table with PMTask Total and applied the same in GI:


But its currently splitting the amount on task level. How can I apply to display the sum of these?
 

​​​
Thanks in advance.

Badge +18

Hello @Harshita ,

Group by Project on the Groups tab of GI.

Add “Sum” to Aggregate column on the PMTaskTotal column in the Results tab.

Laura

Userlevel 6
Badge +3

Hello @Harshita ,

Group by Project on the Groups tab of GI.

Add “Sum” to Aggregate column on the PMTaskTotal column in the Results tab.

Laura

Hello @Laura02 ,
Thank you for your suggestion. As you mentioned, I implemented as following:


But it displays the following amount:


I am also looking to display the Revenue Row → figure under Revised Budget Amount.
I tried using PMTaskTotal.Income, but it displays the same figure - 161705.40. Also the decimals are getting increased 😅​​​​​​​

Userlevel 7
Badge +12

Sorry @Harshita I misread your screen that was for the Income for the Budget you will need to use 

PMBudget as your table and Group by the ProjectID and Type (. This has the Revised Budget Amount in there)

To not show the decimal on the GI by setting the Schema Field (the result will be formatted to how this screen displays), also just a tip you can can use the Total Agregate Function to do the SUM as well.


Userlevel 6
Badge +3

Sorry @Harshita I misread your screen that was for the Income for the Budget you will need to use 

PMBudget as your table and Group by the ProjectID and Type (. This has the Revised Budget Amount in there)

To not show the decimal on the GI by setting the Schema Field (the result will be formatted to how this screen displays), also just a tip you can can use the Total Agregate Function to do the SUM as well.


Hello @dcomerford ,
As you suggested, I tried as following:


Trying to add a parameter that would display the result for the selected Project only


The result:
 

Whereas the original figure is:


What is it that i am missing here? Also for the decimals part.

Userlevel 7
Badge +12

@Harshita Sent me the GI and let me look.

Userlevel 6
Badge +3

@Harshita Sent me the GI and let me look.

Attaching the XML format of GI:
 

Userlevel 7
Badge +12

@Harshita Use the Type as the parameter see attached it matched my examples


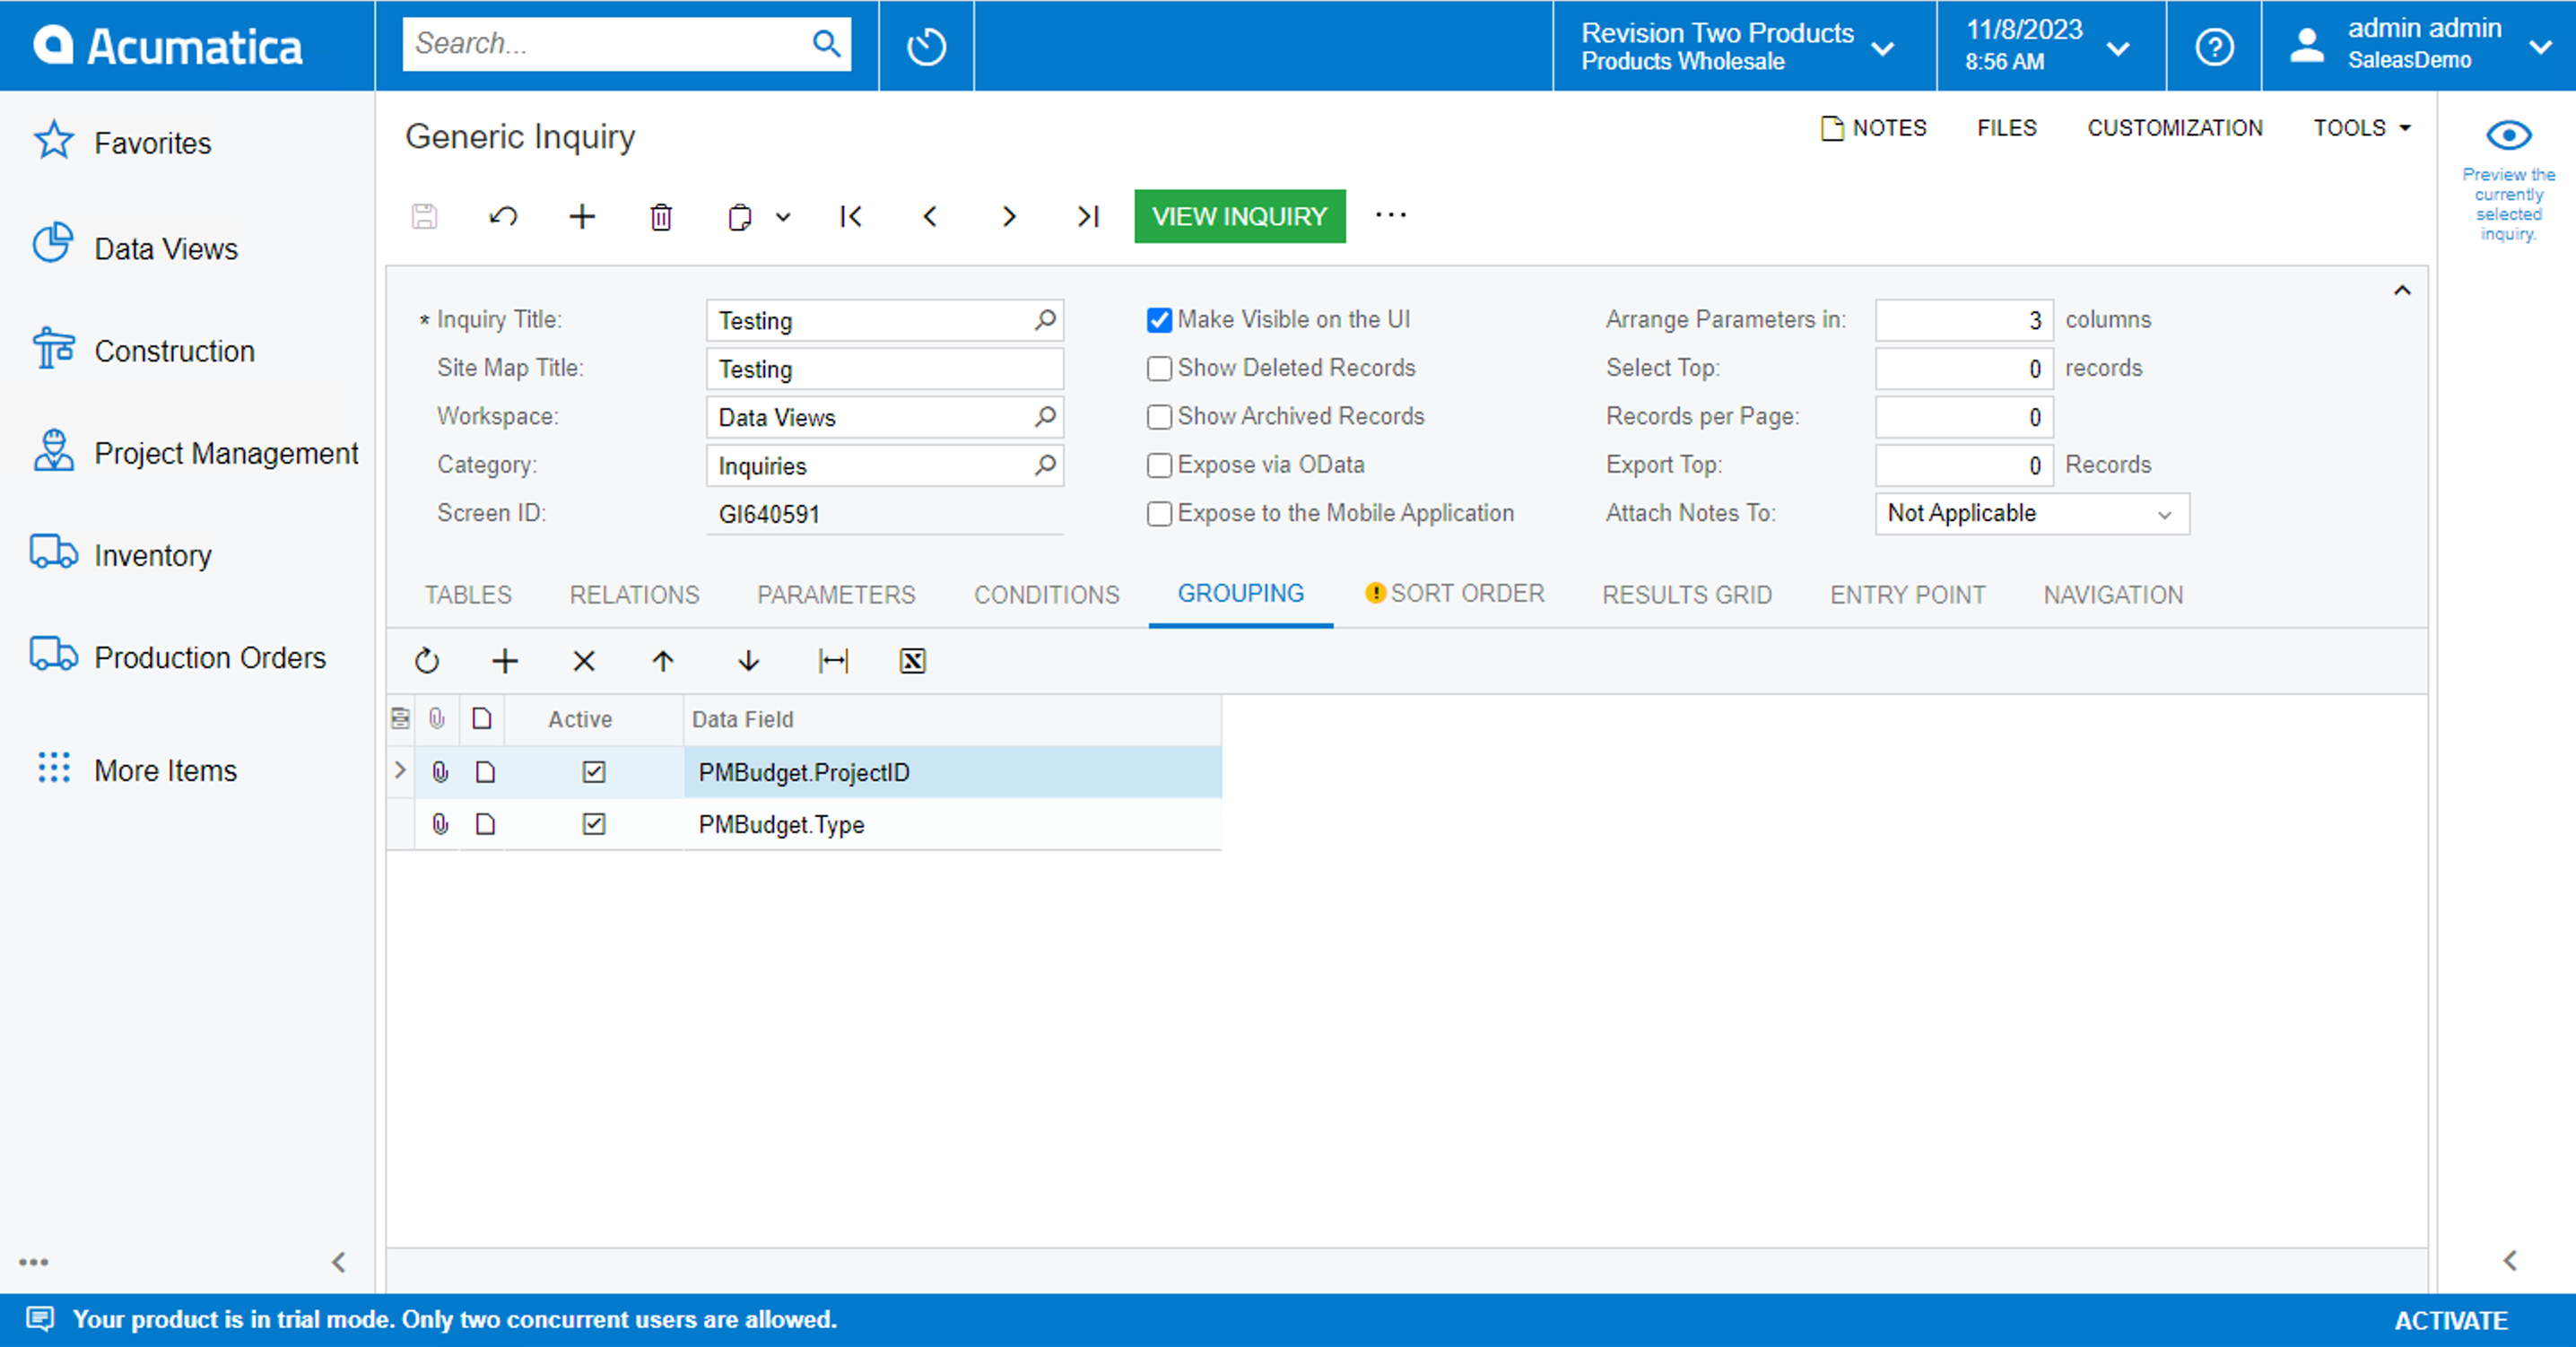
The Type will be Income/Expense/Asset/Liability


Reply


About Acumatica ERP system
Acumatica Cloud ERP provides the best business management solution for transforming your company to thrive in the new digital economy. Built on a future-proof platform with open architecture for rapid integrations, scalability, and ease of use, Acumatica delivers unparalleled value to small and midmarket organizations. Connected Business. Delivered.
© 2008 — 2024  Acumatica, Inc. All rights reserved