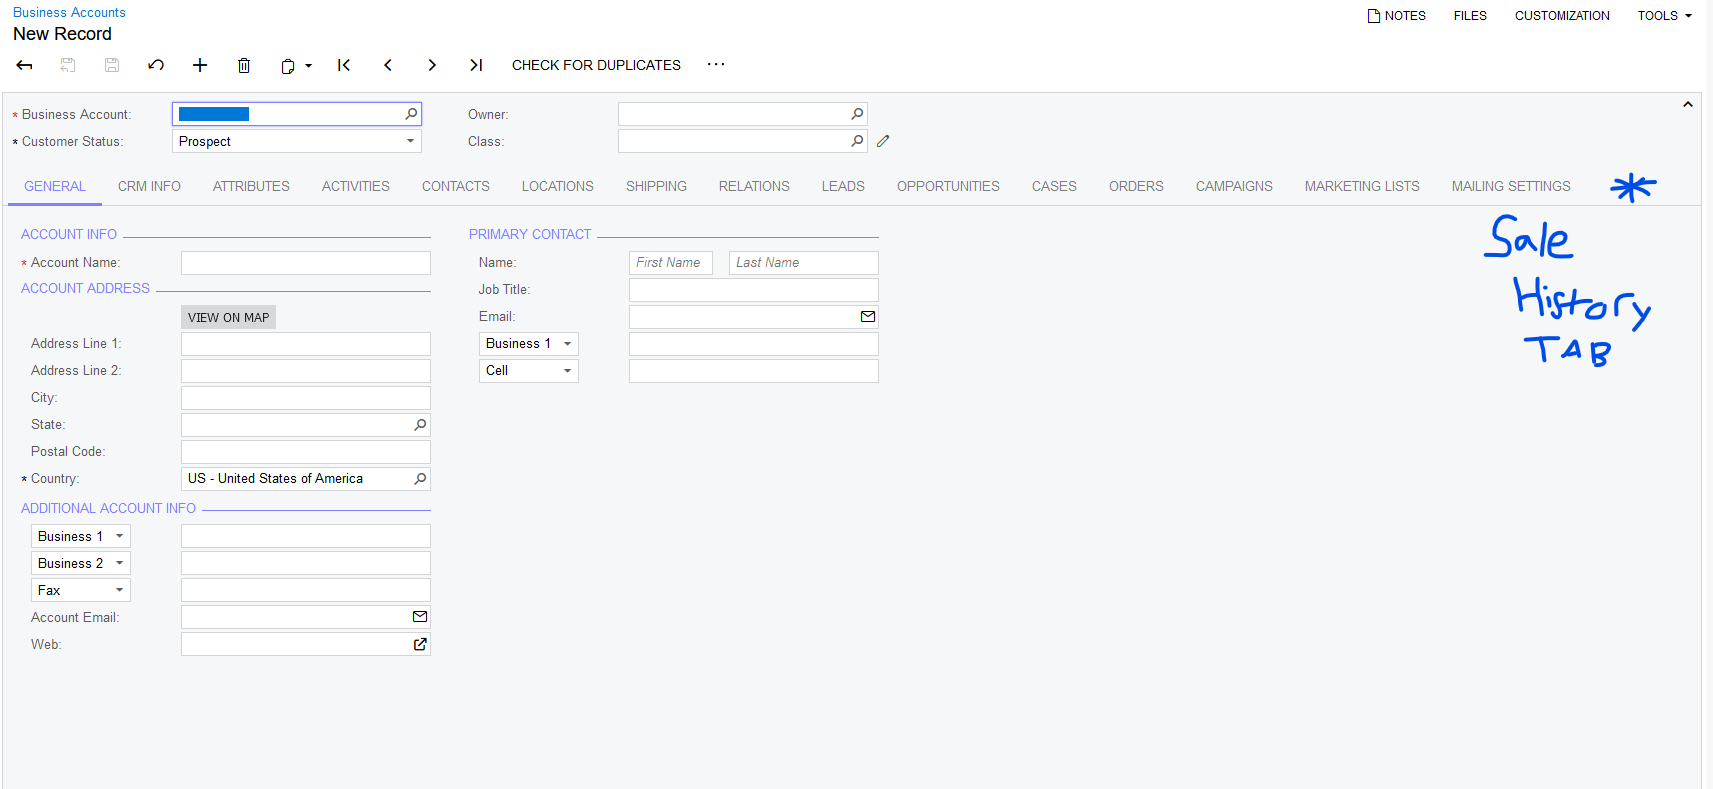
What you are asking for, will require customization as follows.
1) Create a graph extension
2) Add a public view joining required DACs to get your desired output.
3) If you want some subtotals from details, you might need to create one or more projection DACs then use them in the above mentioned View
4) Add a custom controls (Tab, Grid, fields) to UI and connect them to the View
Alternatively depending on the complexity of output you need, you MIGHT be able to add a custom GI and Side Panel instead of custom tab. It will need customization but it’s easier for non-programmers
Just to clarify, are you looking for help or for someone to do it for you?