

Hello everyone,
Does any one knows how to create a multi level axis in the report designer? Report designer is adopted from excel. But the charts setting is limited. I want to create a multi level chart that grouped by month and product. Has anyone done this before? Thanks for sharing.
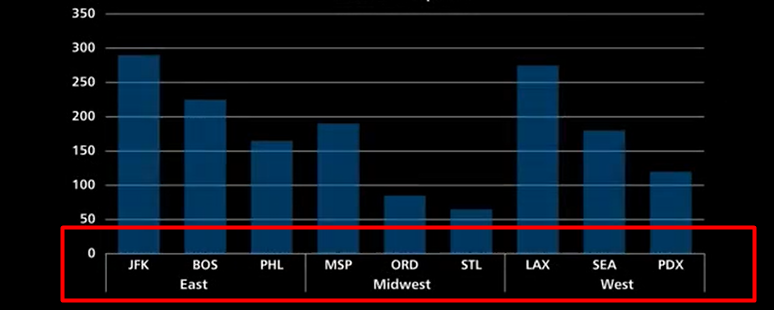
Excel sample:
Best answer by BenjaminCrisman
View original
