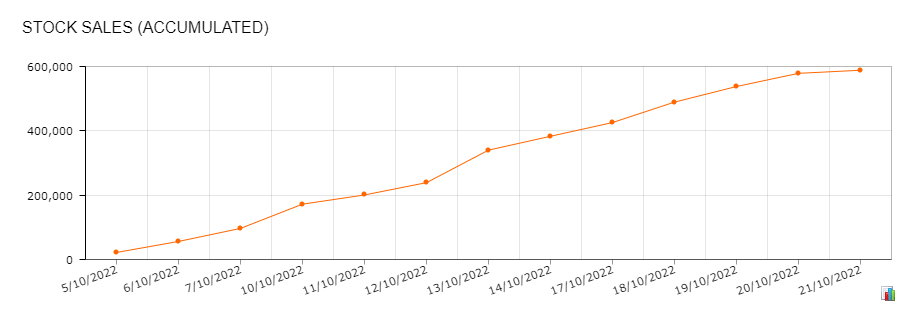
I am looking for a way to have widget showing accumulated sales figure over time, something like this:
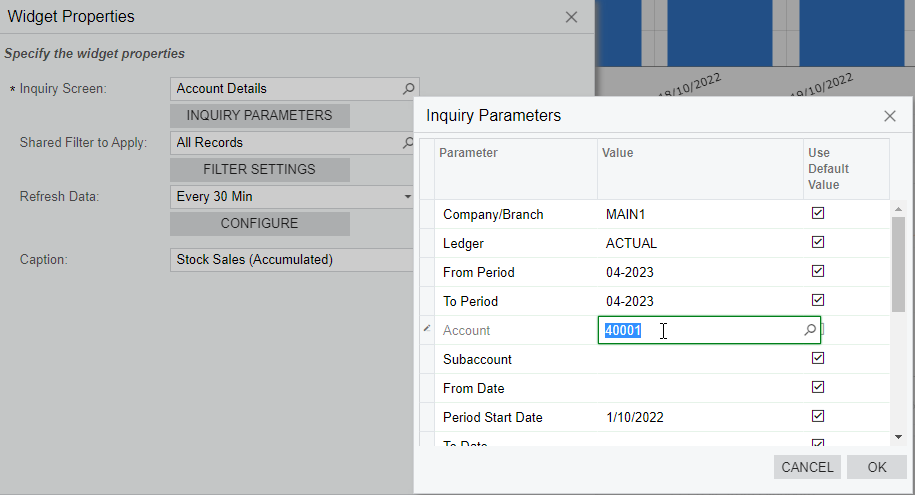
I use Account Details as data and kind of works, however I can only use one account instead range because there are several sales accounts.
Appreciate if anyone can assist.
Best answer by BenjaminCrisman
Hi @kristianharianja! I think for this issue you’ll need to make a GI which can use one of the HistoryByPeriod (GLHistoryByPeriod comes to mind :) ).
This way you can show the balance at a particular point in time and multiple periods leading up to the last period.
There’s a great bit of help on this in the GL DAC Overview:
https://help-2021r1.acumatica.com/(W(3))/Help?ScreenId=ShowWiki&pageid=0706f316-2b71-6254-44dc-65544025f479

