Solved

Where should I start looking to find out where this end point is slowing down?

  • 27 September 2023
  • 5 replies
  • 64 views

Userlevel 7
Badge +5

We have customized the SalesOrder endpoint.  We’ve noticed that for some orders, it takes a “long time” for the json to be returned. In this one case, an order is taking 10 seconds to be returned.

I’ve determined that it has something to do with combinations of the detail elements that we want expanded.

Elements included in expand Seconds for data to be returned
Details 1.1s
Details, CustomDac1 1.27 s
Details, CustomDac1, ShipToAddress, Payments 4.18 s
Details, CustomDac1, ShipToAddress, Payments, CustomDac2 11.32 s
Details, CustomDac2 2 s
Details,CustomDac2, ShipToAddress 1.67 s
Details,CustomDac2,ShipToAddress,Payments 1.97 s
Details,CustomDac2,ShipToAddress,Payments,CustomDac1 10.49 s
Details,CustomDac2,CustomDac1 9.11 s


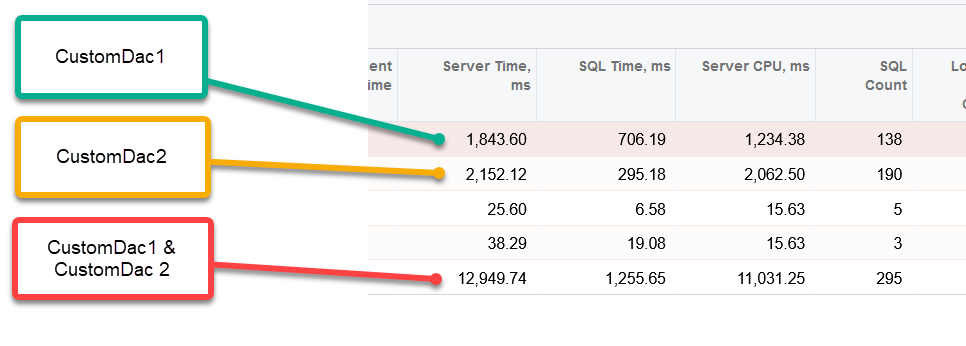
So, CustomDac1 with Details = 1.27 s.  CustomDac2 with Details = 2 s. Details, CustomDac1 and CustomDac2 is 9.11 s.

When I expand CustomDac1 and CustomDac2 together, something happens and the query times increase substantially.  But when they are each run individually, it’s a reasonable speed.

It would be faster to query the API twice.

I’m assuming that I’ll start with a SQL Monitor exercise but given my quick testing results above, the issue isn’t with database performance. Is there anything else I should look towards?

CustomDac1 is simple view on a table I created. The fields being used in the where clause are indexed in SQL and is not the primary key on the table.

CustomDac2 is a view that incorporates a projection. This is from a third parts and I have little control over it. But I did add an index to the table that both the view and the projection are pulling from. Again, the fields being used in the where clause are indexed in SQL and are not the primary key on the table.

icon

Best answer by Django 28 September 2023, 03:18

View original

5 replies

Userlevel 7
Badge +17

Hi @Django  Have you enabled and reviewed the Request Profiler with the below details?

  1. SQL Query execution time
  2. CPU Time
  3. In the SQL → Have you checked is there any same queries are executing multiple time and causing the prmance issues? 
Userlevel 7
Badge +4

@Django, Additionally you can test without customization project to the Sales Orders screen. If the execution time is better you can then debug the customization to identify the cause for the performance slowdown.

Userlevel 7
Badge +5

This is the Request Profiler results for the three options of the GET request:

The database doesn’t appear to be the slowdown. It appears that the server is spending a very long time working on the request when the $expand includes both DACs.

The UI does not suffer any slowdowns. The UI will load up the transaction quickly. This is all an issue via the REST API.

Any other suggestions on what I can look at?

Userlevel 7
Badge +4

@Django, Do you have any customization that works with SOLine or any linked/detailed object that you are expanding?

From the table above, I assume you have CustomDAC2 and CustomDAC1 in the linked/detailed object you are fetching. Do you have any loops that you can optimize?


Edit: You can share the DAC and graph extension that might give us more insight.

Userlevel 7
Badge +5

@Vignesh Ponnusamy & @Naveen Boga - thank you both for your questions and suggestions. I have a work around for the time being.

I looked into the 3rdparty view that I was referencing in the web endpoint. The view was referencing a table and a projection:

TableXYZ and ProjectionABC.

When I looked into ProjectionABC, I found that it was primarily querying TableXYZ and joining in some sundry tables (InventoryItem, etc).

For my purposes, I didn’t need any of the other information that ProjectionABC offered so in my Graph Extension, I added a view and grid that queried TableXYZ as Read Only.

By doing this I was able to speed up the REST API requests.

Now, once I did that, the Payments entity started to slow me down.  Again, my GET requests would take 1.5 seconds and then adding Payments to the $expand list makes the request takes 11 seconds. To add the details for one record.

So I used the Adjustments_Raw view to create a grid and made a FastPayments entity. Querying now is just over a second. Fortunately, I can get away with these alternate views to avoid IEnumerated views.

Reply


About Acumatica ERP system
Acumatica Cloud ERP provides the best business management solution for transforming your company to thrive in the new digital economy. Built on a future-proof platform with open architecture for rapid integrations, scalability, and ease of use, Acumatica delivers unparalleled value to small and midmarket organizations. Connected Business. Delivered.
© 2008 — 2024  Acumatica, Inc. All rights reserved