Solved

Show results in tables and charts as last 365 days

  • 10 January 2022
  • 2 replies
  • 54 views

Userlevel 2
Badge

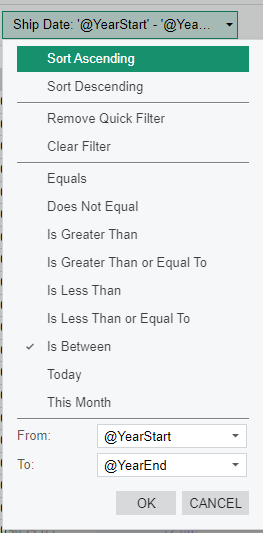
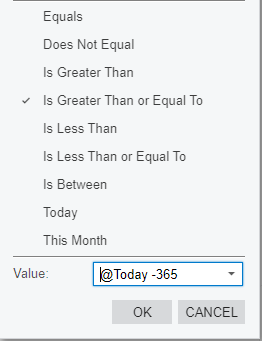
I am trying to use a pivot table to show the sum of sales of an inventory item over the last 365, or trailing 12 months. Acumaitca only gives me the option of using “@YearStart” and “@YearEnd”. I was wondering if there was a value I could type in from trailing 365 days today.


icon

Best answer by Neil Cantral 10 January 2022, 21:17

View original

2 replies

Userlevel 5
Badge +3

Try something like this:


Userlevel 2
Badge

It appears this has solved my issue, thank you!

Reply


About Acumatica ERP system
Acumatica Cloud ERP provides the best business management solution for transforming your company to thrive in the new digital economy. Built on a future-proof platform with open architecture for rapid integrations, scalability, and ease of use, Acumatica delivers unparalleled value to small and midmarket organizations. Connected Business. Delivered.
© 2008 — 2024  Acumatica, Inc. All rights reserved