Solved

dashboard - year over year sales

  • 16 February 2023
  • 2 replies
  • 280 views

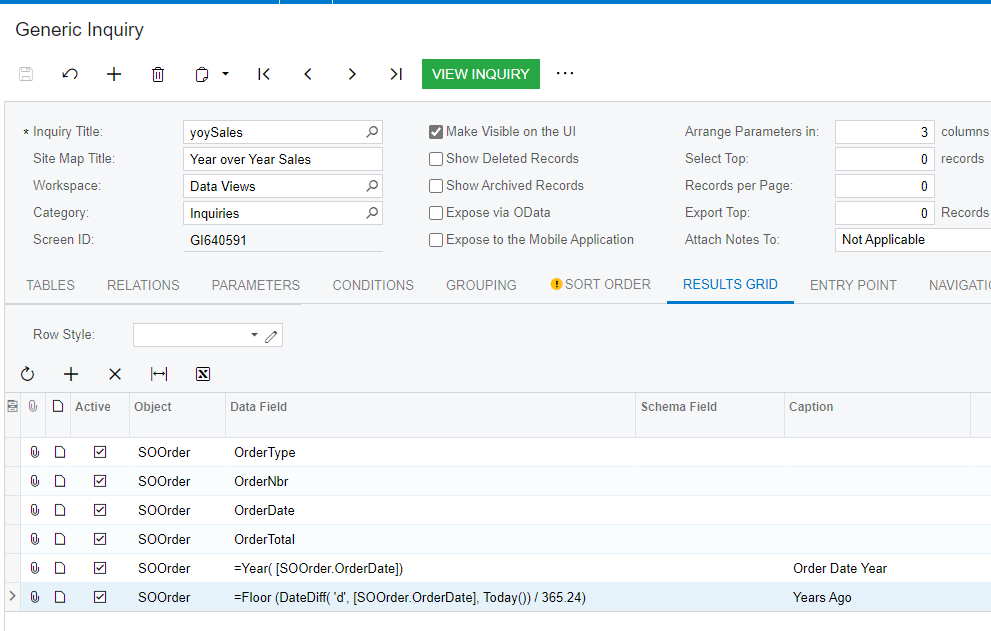
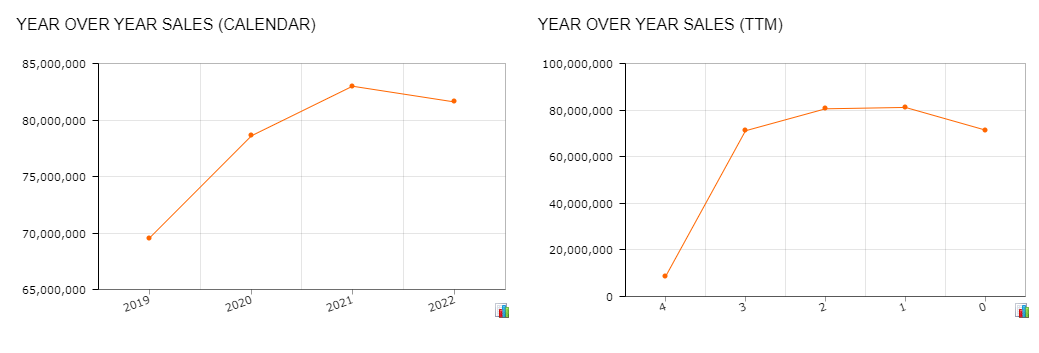
I am trying to create a GI to show this years sales data compared to LY sales. Any ideas how to get started with this? I have pulled the data since @yearstart and for where docdate >= @yearstart-1 and docdate<= @yearstart-1. How can I show those on the same line graph?


icon

Best answer by aaghaei 17 February 2023, 09:44

View original

2 replies

Userlevel 7
Badge +8

Whatever you want to show on axises will need to be in one column. So in your case you will need 2 columns in your result grid (of course you can have more columns but for sake of DB I mean). One column is going to be Year and another one Amount or Quantity. The qry or amt is straight forward. For the year column you will need to use a formula that extracts the fiscal year based on a fixed value comparison or a cutoff month parameter. Possibly the easiest way is to get the left 4 digit of TranPeriod or FinPeriod. Something like =Left(DAC.TranPeriodID, 4) or get year from DocDate something like =Year(DAC.DocDate)

In DB then you will use this formulated column let say you call it Year, as axis and Amount as value and you can have a comparison column chart

Userlevel 7
Badge +3

@jsparks62 User @aaghaei described the solution. I had to do something like this a while ago using Sales Orders so I thought I would share some screen shots.
 

Inquiry Results Grid (last line is if you want trailing twelve months)

Resulting Dashboards

Data Conditions select Order Dates between @YearStart-4 and @YearStart (favors Calendar) select Order Dates between =DateAdd(Today(), ‘y’, -4) and Today() if you are using Trailing 12 Months 


Reply


About Acumatica ERP system
Acumatica Cloud ERP provides the best business management solution for transforming your company to thrive in the new digital economy. Built on a future-proof platform with open architecture for rapid integrations, scalability, and ease of use, Acumatica delivers unparalleled value to small and midmarket organizations. Connected Business. Delivered.
© 2008 — 2024  Acumatica, Inc. All rights reserved