
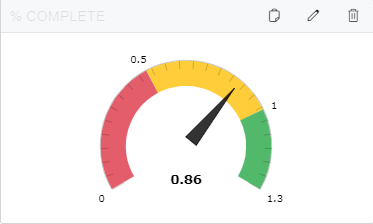
Hi I am attempting to build a widget that shows percentage orders completed on time.  I’m having a tough time shaping the data.  A simple table below - I’d like to show OnTime as a percent of “yes” values.  Ideally I’d like to use the meter KPI, in below example it would read 75% for the month.  Any suggestions?  


Date Order# OnTime
2021-10 1200 Yes
2021-10 1201 Yes
2021-10 1202 Yes
2021-10 1203 No

Hi @kirbygompf32 ,

Instead of using ‘Yes’ and ‘No’, you could use 1.0 and 0.0 in the GI formula.  For example to count complete sales orders the form would be something like this:

Be sure to include the decimal points in the values, otherwise it will treat the values as integers and the average won’t work properly on the widget.

Here are some sample widget properties that might do what you’re looking for:


Let me know if that helps!

Laura


Hi @kirbygompf32 ,

Instead of using ‘Yes’ and ‘No’, you could use 1.0 and 0.0 in the GI formula.  For example to count complete sales orders the form would be something like this:

Be sure to include the decimal points in the values, otherwise it will treat the values as integers and the average won’t work properly on the widget.

Here are some sample widget properties that might do what you’re looking for:


Let me know if that helps!

Laura

Yes, we had the same kind of issue but could able to fix the issue by adjusting the GI as suggested above by Laura. 


This is excellent! Thank you for the solution. 


Reply