
Hello,
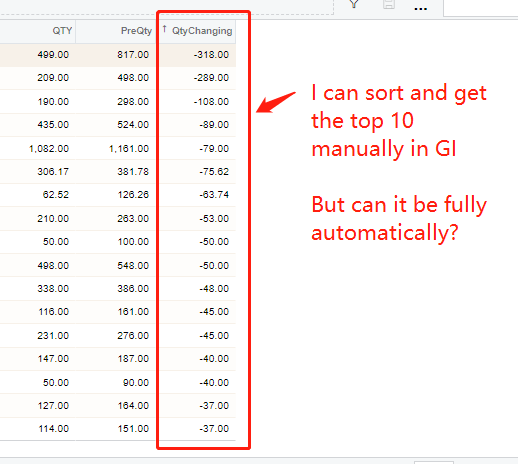
I have a need to find out the top 10 items with the most sales qty drops comparing to last month.
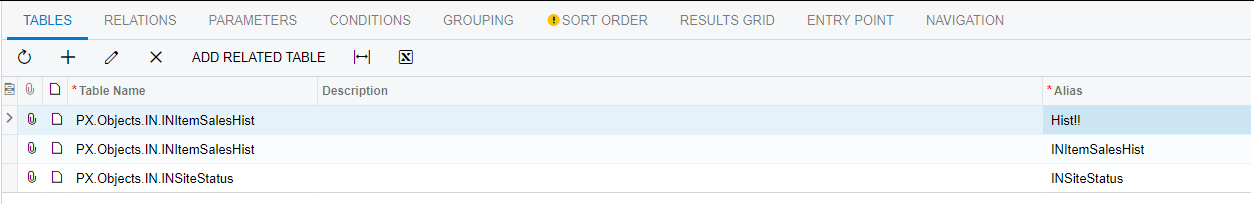
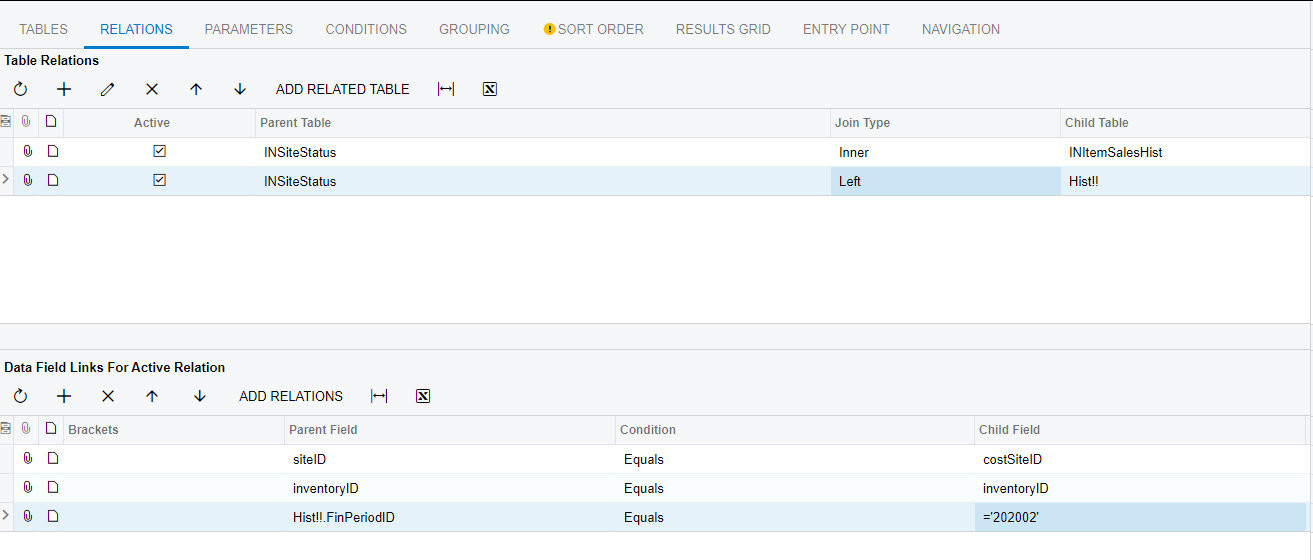
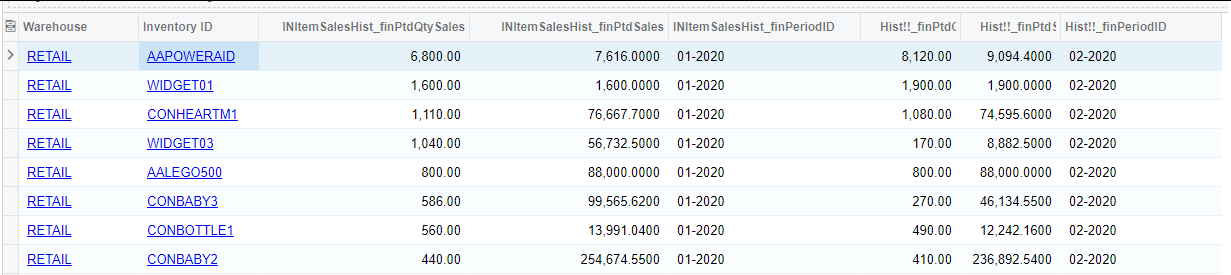
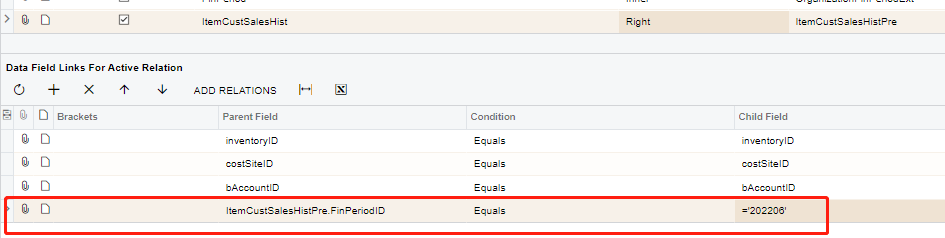
It could be done by sum up the figures group by item this month---------Result 1
And sum up the figures group by item last month-------Result 2
Then, I can do caculate in excel by comparing result 1 and result 2.
I am just wondering is there any way that I can get the final result directly in Acumatica with GI or Report? Thank you in advance.
Solved
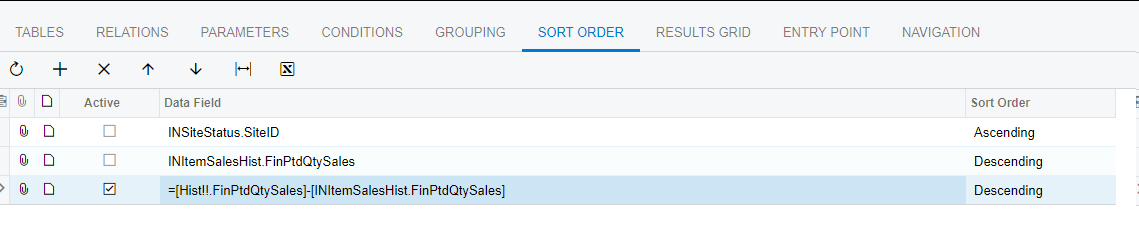
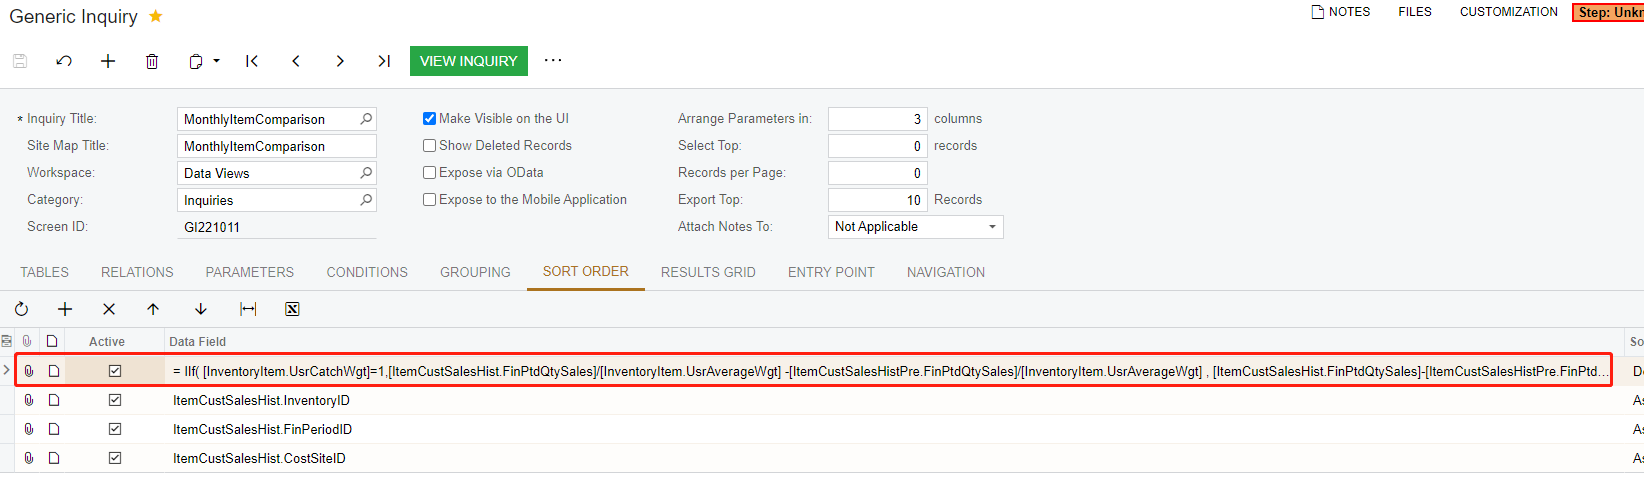
Find out the top 10 monthly sales qty increasing/decreasing items in just 1 report.
Best answer by DConcannon


Login to the community
No account yet? Create an account
Social Login
Login with your Acumatica accountEnter your E-mail address. We'll send you an e-mail with instructions to reset your password.