Solved

Dashboard- How to change the color in chart setting for the chart

  • 15 October 2020
  • 3 replies
  • 1014 views

Hi 

Now i currently the chart color all are blue .May i know how to change to other color that we preffered like green , orange , purple and etc .

Understand we need to go in the chart setting to type in the common. 

Not sure who can share with me the step of how to change the color or any video link can send to you?


Thank you very much

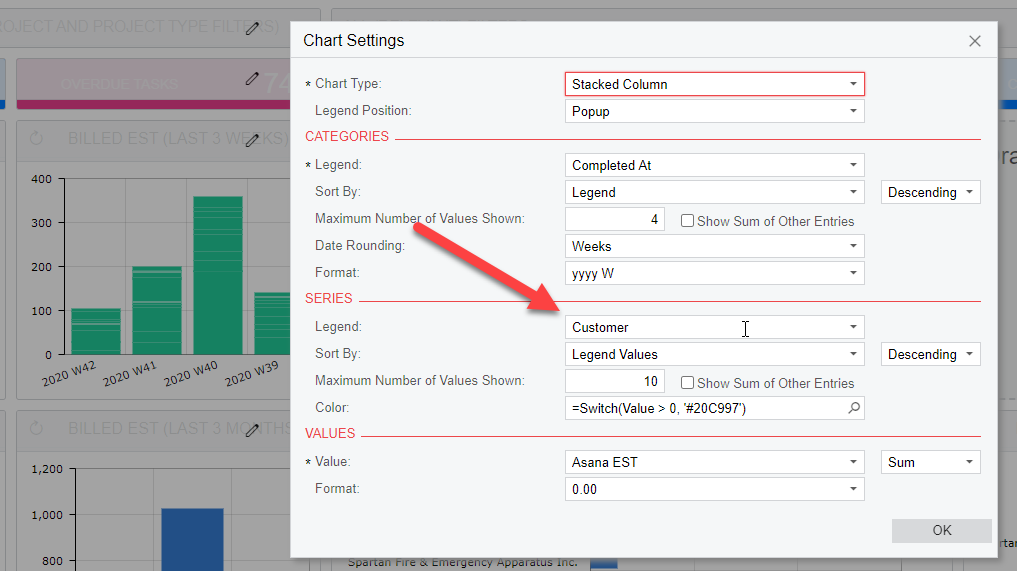
You will need to select a field in the legend field under the series section.


This can be done from the configuration area of the widget. 

When you open the configuration screen of the widget, under the series section, you will see a box for color

This is where it is set. See help document for examples of the syntax. One exmaple is copied below

https://help-2020r2.acumatica.com/(W(4))/Help?ScreenId=ShowWiki&pageid=3945ba5c-e03b-4ef2-9669-5b1aabaa0219

=Switch(Value = 'Billed', '#20C997', Value = 'Non-Billable', '#E83E8C')


You use the switch command to set whatever value of data you want with a color


Hi ccleary

Thanks for your explanation,However , i am not able to do it,

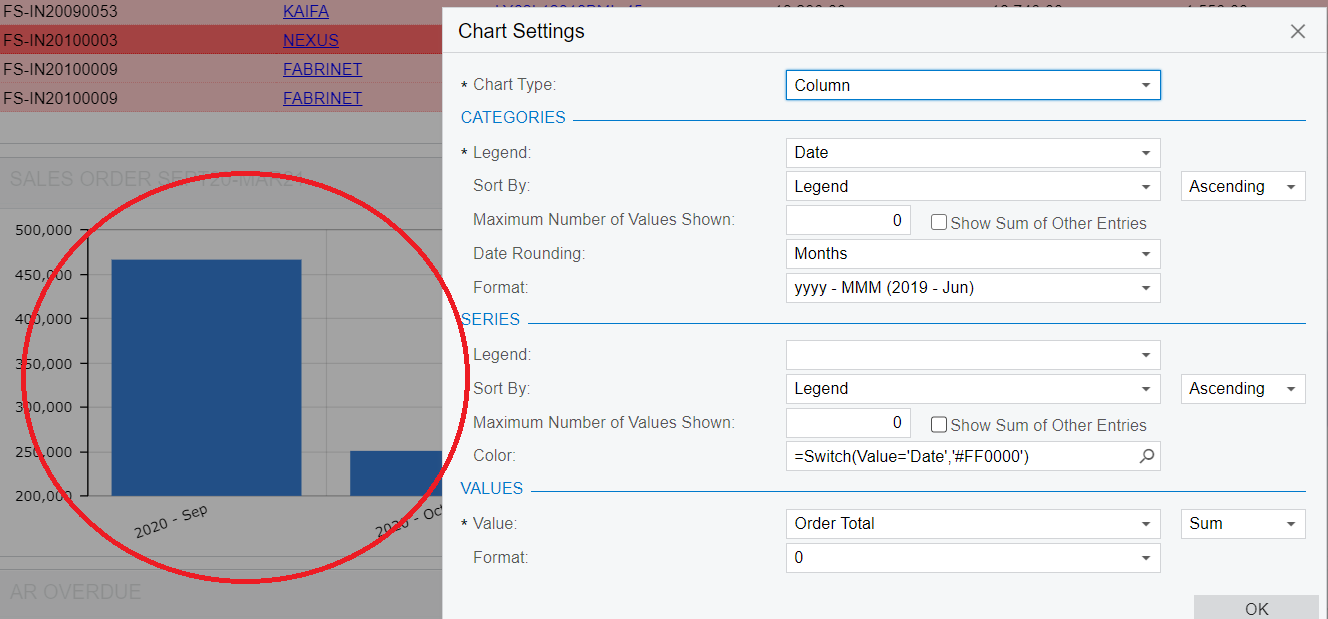
below is my screenshot. and the red circle in the left side bar is what i want to change to other color example : FF0000 where i enter in below column “ color” .

Could you please help me take a look where i entered in wrong way?


Reply