I am testing Seasonality Replenishment
The help is a bit vague - it says useed to reduce of increase repl qty
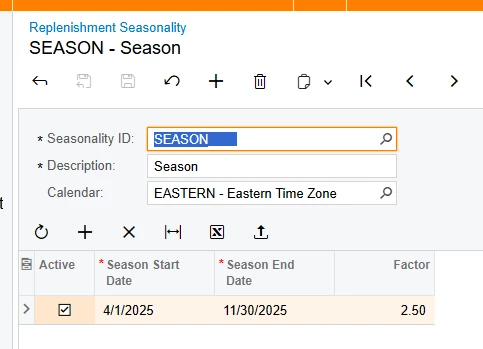
I am finding the factor shown below is reducing the repl qty
Is this correct ?

I am testing Seasonality Replenishment
The help is a bit vague - it says useed to reduce of increase repl qty
I am finding the factor shown below is reducing the repl qty
Is this correct ?
Best answer by PaulMainard55
I’ve always understood this feature as a means to adjust forecasted demand, and the factor is a percentage increase or decrease of historical daily demand to predict future demand. This feature is used for calculating replenishment parameters, such as Reorder Points and Safety Stock when using your moving average forecasting model.
As I understand it, the factor is used calibrate historical daily demand over the period defined in your forcasting model, and adjusts the projected demand for the upcoming season.
This article explains it better than I can. Configuration of Replenishment: Demand Forecast Model
Generally speaking, it applies a statistics-based algorithm to calculate historical daily demand over a period of time for the purposes of helping business owners to optimize their inventory levels so as not to overbuy, while minimizing their risks of stockouts.
Not sure if this is helpful, but give it a read.
No account yet? Create an account
Enter your E-mail address. We'll send you an e-mail with instructions to reset your password.