Solved

Sales Orders Side Bar Long Load Time

  • 19 January 2023
  • 5 replies
  • 186 views

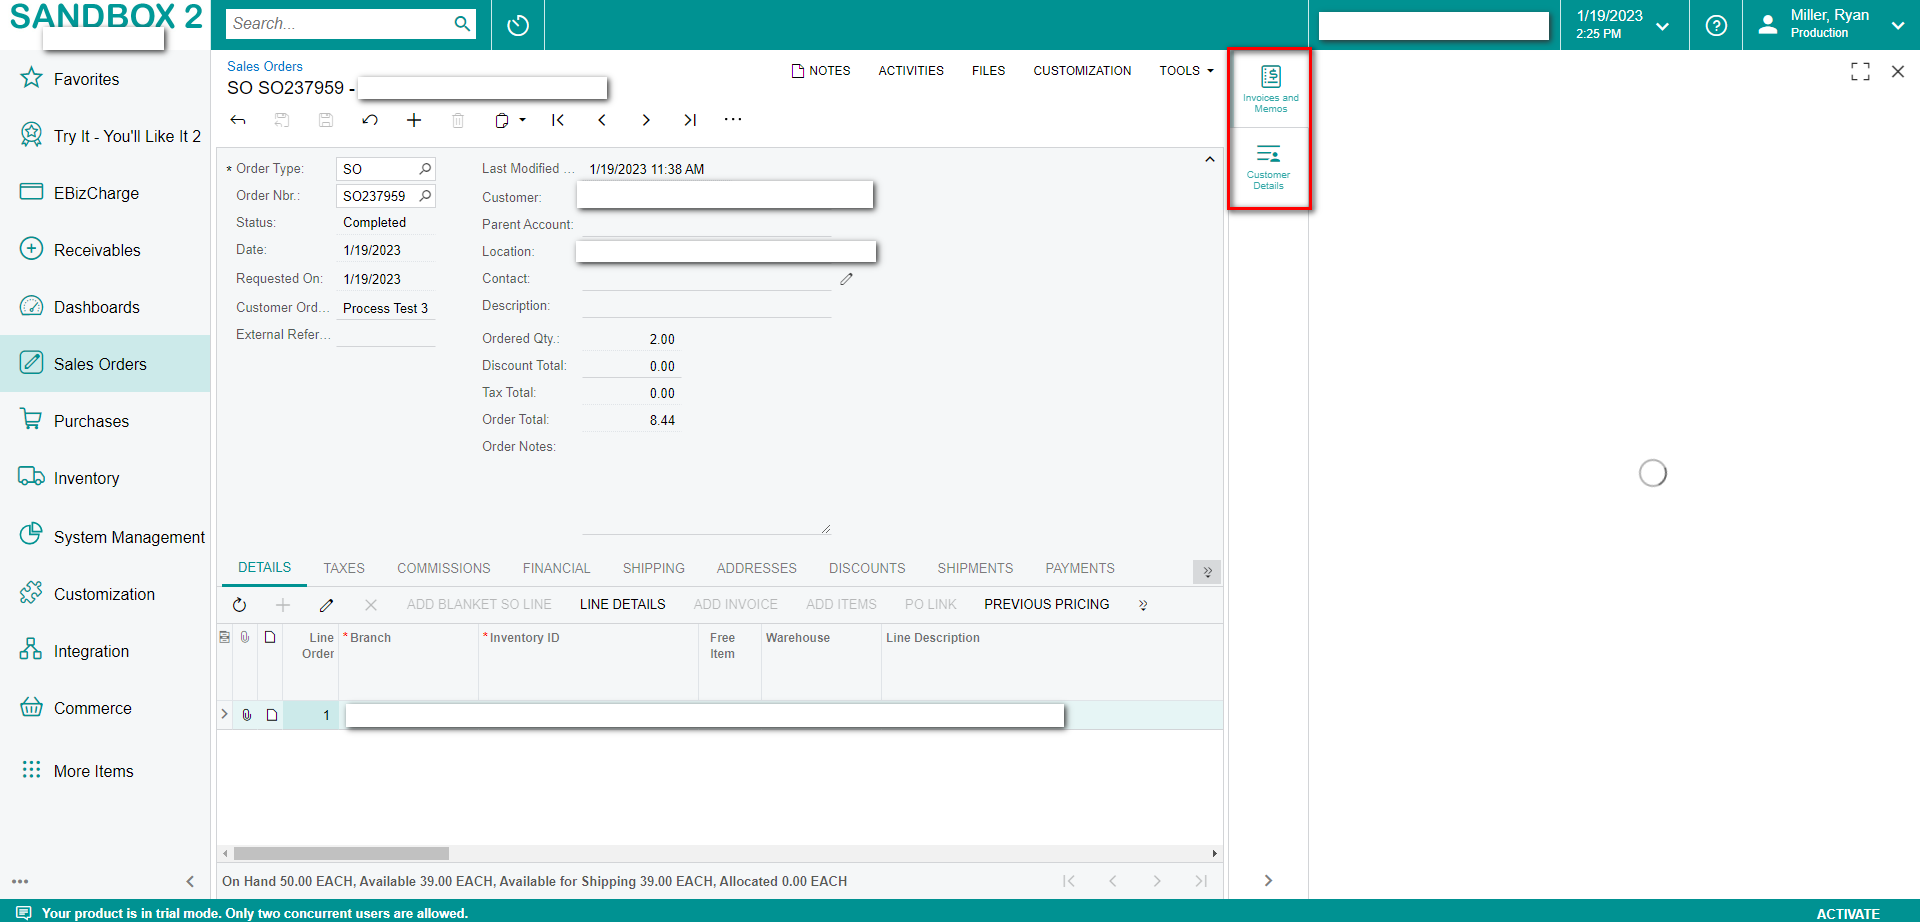
Does anyone else experience extremely long load times on the new side-bars in Sales Orders screen (SO301000)?

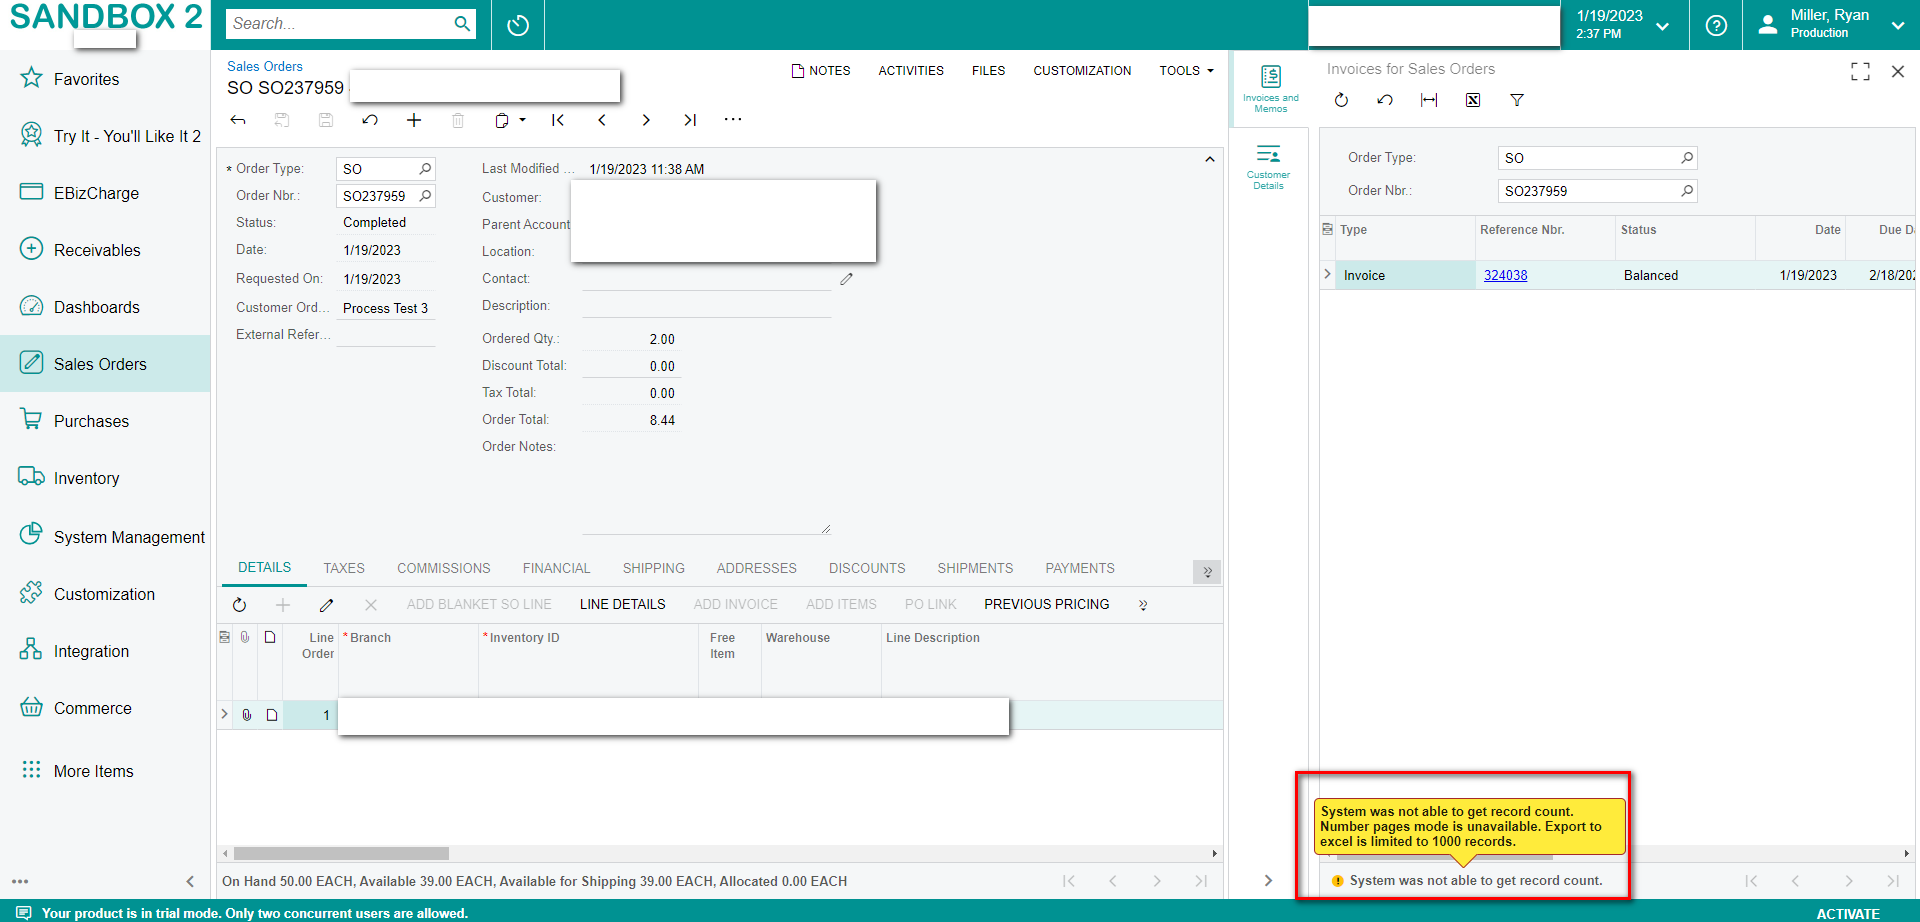
The Invoices and Memos takes 4+ minutes to populate results. While it is running, Acumatica is unusable and the computer it is hosted on goes to 100% CPU usage from the lookup.

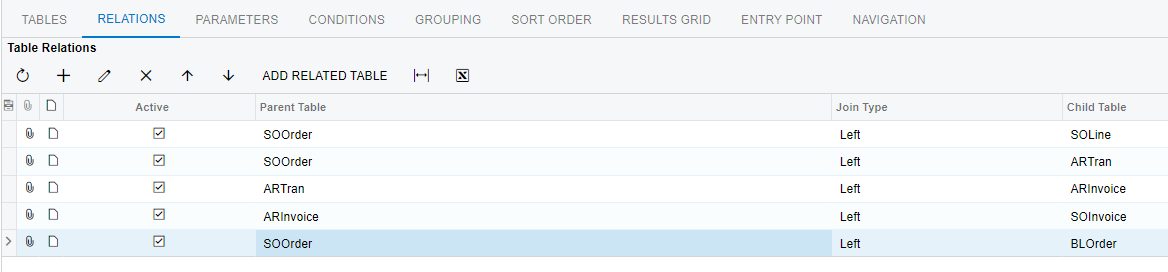
I found the GI the sidebar Invoices and Memos calls(Invoices for Sales Orders, SO3031SP) and tried to limit it to Select Top 100 records, but this had no change on the load time or system lock up. This is definitely the culprit.

Any and all suggestions to eliminate this problem would be very appreciated!

Note: I am testing an upgrade from 2021 R2 to 2022 R2 on a local environment tied to an SQL AcumaticaDB of recent production data.
 

Loading… Loading… Loading...
Error after load


5 replies

Userlevel 7
Badge +4

Hi @rmillerKimball! I think this is going to come down to the performance of the machine you are running it off, or the performance of the server. I tested this on my local 22.206 instance and it loaded in about 15seconds with record count.

Typically the reason why the record count would get missed is that either there are a sizeable amount of records to retrieve, or some system performance issues can cause a GI to complete the query before the record count is completed, so none is provided.

My workstation is an 9th gen Core-i5 with 16GB of ram and it’s not just the only site running, it’s the only app pool running.

When I’ve had multiple sites installed locally and several of the app pools are running at once they can be stopped to improve the performance, and additionally, if you have multiple sites running from the Default App Pool, then it will make sure each site is ready, which is unnecessary.

Are there any other machines to test on to make sure it isn’t something with this machine?

Userlevel 3
Badge

Thank you for your response @BenjaminCrisman,

The PC I am running this on has only one installation / instance of Acumatica on it. It was purchased to be a sandbox environment for Acumatica.
Specs:
12th Gen Intel(R) Core(TM) i5-12500   3.00 GHz
32GB RAM
Windows 10 Pro

It is certainly looking at a lot of records, over 200k showing on screen ID SO3030PL. However, that screen loads nearly instantly on my sandbox. I’m not sure what is making this GI so slow.

I am worried that this will be very similar to the runtime on our production. That is a very appealing side-bar button that my users will certainly want to see what it does. We do self-host our production Acumatica and I don’t have a way of testing how the performance will be on that until we upgrade it. 

Userlevel 7
Badge +8

Hi @rmillerKimball ,

I tried to open the “Invoices for Sales Orders” generic inquiry in my demo data and it also timed out.  This is on version 22.203.0043.  

This GI is pulling together a lot of information.  I would think it could be simplified to include less tables and improve the efficiency.  


Userlevel 7
Badge +4

@rmillerKimball I did notice that there are two relations on the join from ARTran to ARInvoice which are showing as invalid fields, not sure if they could be put somewhere else in the GI or if you can test with removing them to see if it increases the speed?

Userlevel 3
Badge

Great find @BenjaminCrisman!

Deleted those two rows in a copy of the GI and it loaded in < 5s, and still functioned as intended with a Order Nbr entered into the parameter.

Thank you!

(FYI, I was looking at a combined count of 1,562,568 when I totaled up all of the rows in the tables. Yikes)

Reply